This fall, I went through an analytical exercise to build defensive profiles of teams. I looked at data from the 2023 NCAA Women’s season and compared performance in metrics of the 3 main areas of defense (serving, digging, blocking) to Win %. Check those article series out if you haven’t already:
Serving Profiles
Digging Profiles
Blocking Profiles
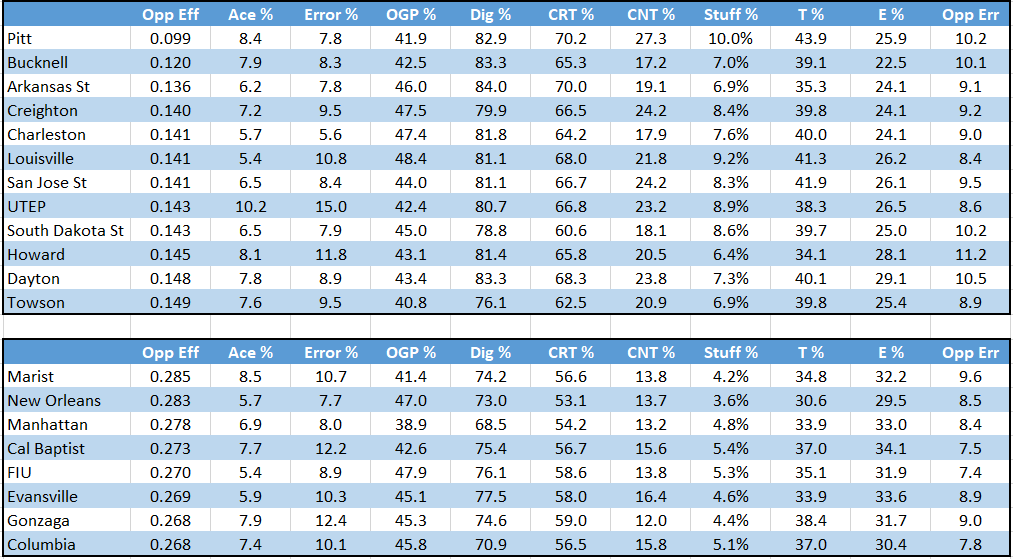
In this article, I’m going to look at the current season and compare some measures of defensive performance. As a sample, I took some of the top (and bottom) performers on Opponent Hitting Efficiency. Here’s what they look like:
The top group is all of the teams who (as I type this) are holding teams under 0.150 attack efficiency. The bottom group is all of the teams who are allowing opponents to attack over 0.260 efficiency.
Let’s look at some of the differences, shall we?
Keep reading with a 7-day free trial
Subscribe to Smarter Volley by Joe Trinsey to keep reading this post and get 7 days of free access to the full post archives.


