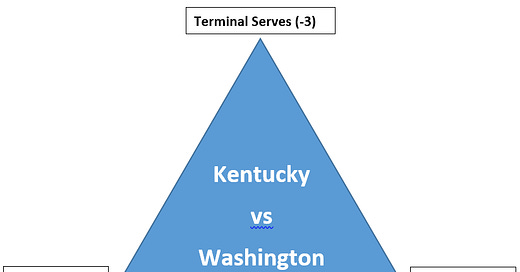
Last week I introduced the concept of the Triangle as a way to analyze matches. There are other lenses we’ll use to view matches, but the Triangle will be a mainstay. I’ve been reviewing last year’s NCAA tournament as we build into the upcoming NCAA women’s playoffs.
I analyzed one semifinal from the 2020-2021 spring NCAA Women’s season: Covid edition. This week we’ll look at the other one, in which Kentucky earned their spot in the final with a 4-set win over Washington.
The Basics
Kentucky won in 4 with set scores of 25-18, 23-25, 25-23, 25-17.
Kentucky scored 98 total points and Washington scored 83. Let’s use the lens of the Triangle to see in which phases Kentucky gained an advantage.
The Triangle Lens
Just like the other semifinal, the losing team had the Terminal Serves advantage, while the winning team had an advantage in First Ball and Transition. In particular, Kentucky had a dominant advantage in First Ball points. Let’s dig a little deeper into each aspect.
Terminal Serves
There were 21 total Terminal Serves in the match:
5 Kentucky Aces
6 Kentucky Serve Errors
6 Washington Aces
4 Washington Serve Errors
This means that Kentucky scored 9 of these Terminal Serves (5 Aces + 4 Washington Serve Errors) while Washington scored the other 12 (6 Aces + 6 Kentucky Serve Errors).
5 aces to 6 service errors is a strong ratio for high level NCAA women’s volleyball, so Kentucky doesn’t feel bad about that at all. But UW serving 6 aces on just 4 service errors is a particularly strong ratio. What’s unusual for UW is that 5 of those 6 aces came in a single set (set 2, which they won), indicating that they might have been a little up and down in their service pressure throughout the match.
In a repeat of the other semifinal match, despite UW winning Terminal Serves, their rate of positive serves (knocking UK out-of-system or better) was just 21%, compared to Kentucky’s 25%. So there’s more to the serving in both matches than just aces and errors. In the other semifinal, a high in-system passing % helped lead Texas to a stronger First Ball performance, and it looks like that held true in this match as well.
First Ball
There were 94 total First Ball points in this match:
39 Kentucky First Ball Kills
14 Kentucky First Ball Stops
30 Washington First Ball Kills
11 Washington First Ball Stops
So of the First Ball points, Kentucky scored 53 and Washington scored the other 41. A 12-point advantage in one phase of the game is usually enough to win you the match, and that was the case for Kentucky.
In fact, Kentucky killed the ball on nearly half the time that UW served in and more than half of the receptions that they turned into hitting attempts. You’re not going to lose very often in women’s volleyball with those kind of hitting numbers.
Unlike for Texas, Kentucky didn’t rely on their middles to dominate in First Ball, it was largely done by their left-side attackers, who accounted for over half of their First Ball Kills. Avery Skinner led Kentucky in kills that night, both in first ball and in transition. Here’s her kills in First Ball:
There’s a lot to like here, but what stands out to me most is the proportion of swings taken high off the block. In particular, the kill at 0:18 is a high-level swing that I love. It’s a long-distance set that’s dying a little inside. The temptation is to bury that ball low into the seam. Hitters definitely kill that ball, but if the blocker drops in and clamps you, you’re asking to get stuffed. She shows good hand control to keep that ball high with a little thumb-up action to go off the block into the deep seam. Really nice play there.
Transition
The third aspect of the Triangle framework is Transition. There were 66 total Transition points in this match, with Kentucky earning 36 of them and Washington winning 30.
26 Kentucky Kills
10 Kentucky Stops
18 Washington Kills
12 Washington Stops
Like last week, the number of transition opportunities also played a big factor. Kentucky had 76 transition attempts while UW only had 58. Again, UK’s ability to terminate in First Ball limited Washington’s chances to score in Transition.
The Transition chain goes: Dig → Create → Convert. UK had more creates, which led to more converts. All three links in the chain have to be strong. We’ll look more at each of those links in future articles.
Portion Of The Game In Each Phase
Another interesting note is the portion of the game played in each phase.
In this match, 12% of serves were Terminal, 52% of points were decided in First Ball, and 36% of rallies went into Transition.
When Texas played Wisconsin, 13% of serves were Terminal, 42% of points were First Ball, and 45% of rallies were decided in Transition.
So the semifinal between Kentucky and Washington was a First ball game, whereas the Texas - Wisconsin game was played a bit more in Transition. That’s something that I keep my eye on when I’m analyzing a game: if a team is good in trans, they want to turn the game into a transition battle. If a team knows they are dominant in first ball, they want to make it a sideout contest.
Next week we’ll look at the finals through the Triangle lens and see how things shook out.


