Previously, I discussed some advanced beach statistics related to blocking or not blocking.
To Block Or Not To Block
This spring I’m doing 3 different running article series. On Tuesday, I’m releasing articles aimed at giving you a small, specific tool to make your in-practice or in-match coaching more effective. On Fridays, I’m writing about ways to increase the physical capability of players. On Sundays, I’m releasing a more statistically-oriented beach article.
Let’s get into some of this information a bit more. In particular, we’re going to look at the difference between Kill% and Efficiency and, by extrapolation, the relative advantages of producing blocks (at the cost of getting tooled) vs producing digs- which may or may not lead to kills.
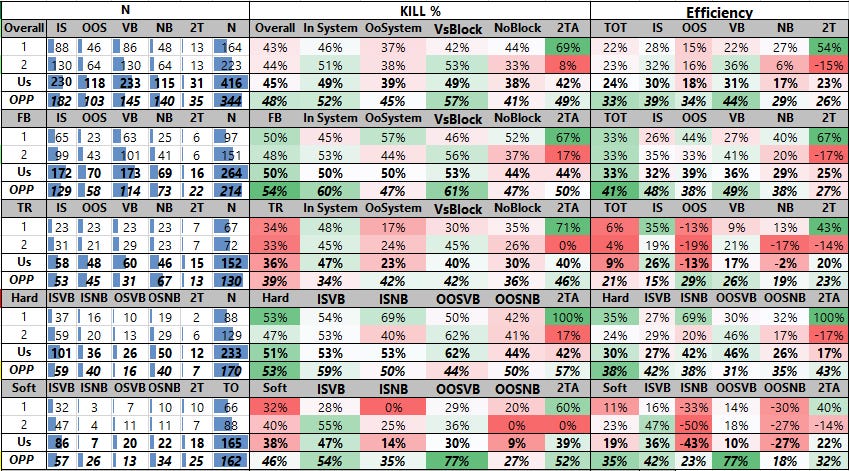
Okay, let’s look at some numbers to start to see what I mean:
I highlighted the overall attacking VsBlock Kill% and Efficiency. What do we see here:
Kill and Efficiency
Partner1 → 58% Kill, 36% Efficiency
Partner2 → 59% Kill, 46% Efficiency
Opponents → 47% Kill, 29% Efficiency
Differential
Partner1 → 22%
Partner2 → 13%
Opponents → 18%
Differential is, of course, just “Errors and Blocks.” But since we’re going to look at it VsBlock (where there are both Unforced Errors and Blocks) and NoBlock (where there are only Unforced Errors), calling it Differential makes more sense to me. And from the defensive standpoint, that’s what we’re interested in here… how attackers react to different types of defenses.
Okay, let’s look at the NoBlock Kill%, Efficiency, and Differentials
Kill and Efficiency
Partner 1 → 40% Kill, 21% Efficiency
Partner 2 → 38% Kill, 25% Efficiency
Opponents → 38% Kill, 24% Efficiency
Differential
Partner 1 → 19%
Partner 2 → 13%
Opponents → 14%
Looking at all this together, we can learn some stuff.
Keep reading with a 7-day free trial
Subscribe to Smarter Volley by Joe Trinsey to keep reading this post and get 7 days of free access to the full post archives.


