


2025 LOVB Championship Triangles
I kinda sorted predicted part of it
In the 2025 LOVB Triangles series I wrote:
I’m afraid I don’t have much interesting insight here. Atlanta was #1 in the regular season and they were at the top of each aspect of the Triangle. Looking objectively, I’d be foolish not to predict them to take home the LOVB championship, and I’d project Houston to face them in the finals.
If I had to make an upset pick? I’d probably go with Austin. Their point differential suggests they should be more like 7-9 instead of 5-11 and they’ve just lost three 5-setters in a row. Sure, in each individual case, the better team is more likely to win a 5-setter. But there’s a lot of
luckrandomness involved in 5-set matches as well and over time, most teams end up about 0.500 in those matches. So I think Austin’s record looks a little worse than their ability. I’m not sure it’s a huge upset for a 5-11 5-seed to beat a 7-9 4-seed, but that’s my bold prediction for you.
I got one upset pick. But jeez, I wasn’t expecting the whole playoffs to be one big upset. Congrats to Austin for taking home the championship. Let’s break down the numbers and see how they did it.
Playoff Triangle
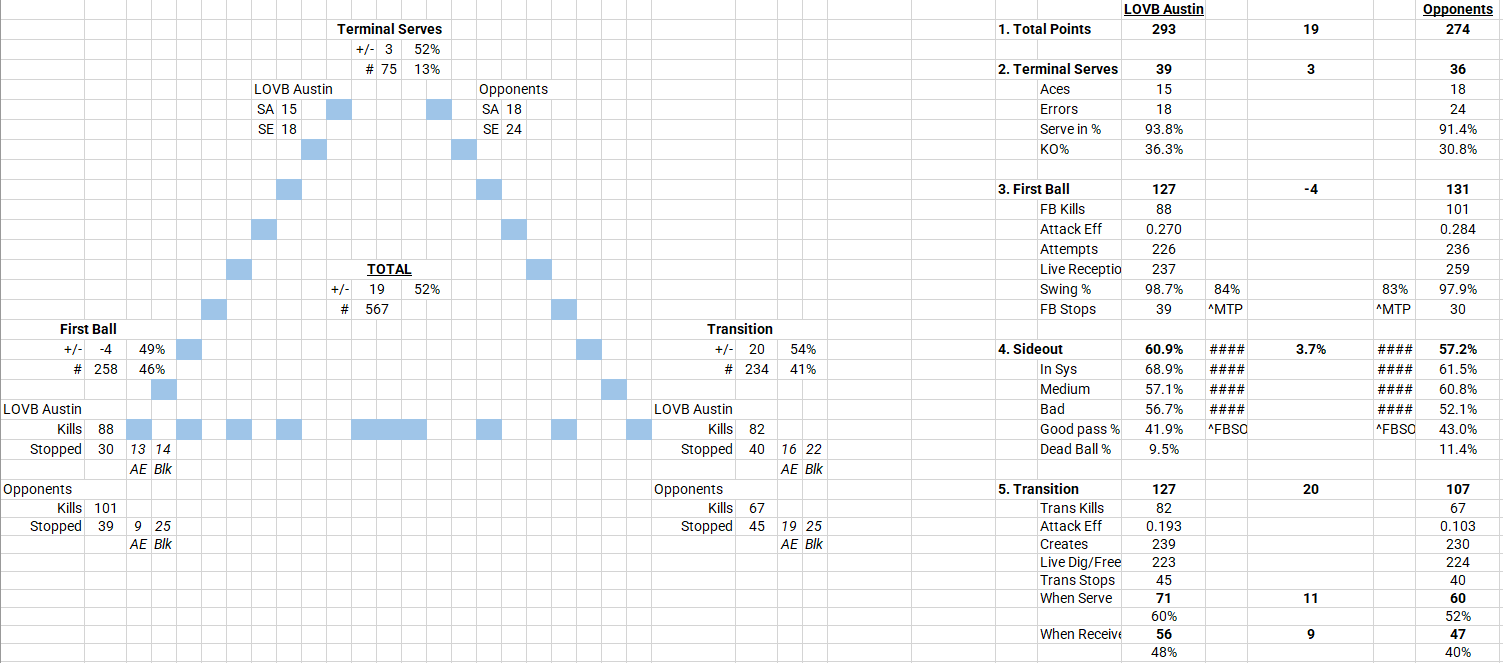
Two things stand out. +19 isn’t a huge differential for winning 3 straight matches, but it’s not unheard of. For comparison, when Penn State won the recent NCAA Women’s National Championship, they had a +17 differential and a reverse sweep of their won thrown (where they were actually outscored for the match) in there. The first round against Salt Lake was 5 straight deuce sets. What are the odds of that? 1-in-1,2001. Pretty interesting to have it come up in the playoffs!
Okay, let’s compare their playoff Triangle to their regular season Triangle and see what we come up with.

Here you can see the difference between playoff and regular season: significant improvement in Transition and Terminal Serving. Since both Austin and opponents were relatively low-ace, low-error (94% and 91% Serve-In respectively with both Austin and opponents below 1.5 aces per set), the big difference in terms of total points was in Transition.
And where was the improvement? Almost entirely on the block/defense end.

I noted in a regular season analysis that there was almost perfect correlation between a team’s block/defense in First Ball and that team’s block/defense in Transition. That diverged here! Austin didn’t defend better (actually, a bit worse) in First Ball, but they were much better blocking and defending in Transition. In the regular season, they had 2.7 digs per every opponent Transition kill. In the playoffs it was 3.3. So even though they didn’t attack better in Transition, they gave themselves so many more opportunities that it led to winning more points.
We can see the improvement in Transition reflected in their Sideout by Pass Quality:

We can see that their sideout offense wasn’t really any better. Hence no real change in First Ball differential. They weren’t any better In-System and were a bit worse on Medium balls. But where they really improved was siding out after a Bad Pass. And what happens more after a Bad Pass? Transition!
That’s why all of these elements of the Triangle are not totally independent. There’s some difference between serving aces and serving the opponent out-of-system, but they overlap. There’s some difference between your ability to attack in First Ball and attack in Transition, but there’s plenty of overlap. But to me, the clear takeaway is the value of Transition. We saw be the deciding factor in Penn State’s NCAA championship run, and now we see it be the deciding factor for an Austin team that went from 5-11 to league champions in the span of a weekend.
https://chatgpt.com/share/68025448-f184-8008-8072-fb0f7e68c986 if you want to check my math on the Monte Carlo simulations
Geek alert: Love the circular radar chart to show triangle data. Is that achievable in Excel?