2024 NCAAW Season Analysis
Every year on SmarterVolley I have at least one content cycle that’s based around extensive statistical analysis of a large data set. American NCAA Women’s volleyball is pretty good at providing that, so I tend to pull heavily from data from the fall NCAA seasons, but some of the past analysis includes FIVB stuff, men’s stuff, etc.
2023 Defensive Analysis
2023 Offensive Analysis
2022 Major Competition Analysis
2021 Triangle Profiles
All of these have a similar flavor to them and I use many of the same tools, but I try to come at things a little differently each year so you won’t get bored and cancel your subscription can see some of the different methods of analyzing teams. Let’s dive into this year’s
Quick notes:
First of all, if you are unfamiliar with the Triangle analysis framework or some of the other terminology I use here, check our the Triangle Primer that I updated for this year.
Second, some details on the data-set: I used the top-100 teams in the NCAA and pulled all of their dvw files from all matches. I didn’t exclude any matches, so everything regular-season and playoffs is in here. Also, Drake is not in here, even though they were top-100 in NCAA. Every now and then a match won’t important properly into Volleystation but for whatever reason more than half of Drake’s matches didn’t important properly. So… nothing from Drake in here. Sorry about that folks.
2024 Leaderboard: First Ball
Let’s take a look at the teams which led the NCAA in First Ball, both overall and in the various sub-components.
First Ball Leaders
Creighton and Pitt topped the leaderboard here. We’ll get into correlations next week, but it’s not hard to see that dominating the First Ball category is going to give you a pretty good chance to win a lot of matches.
Note that what I’m talking about here is the percentage of all points in the First Ball phase that a team won. For example, let’s look at Creighton:
Creighton First Ball
755 FB Kills
437 FB Stops
666 (!) Opponent First Ball Kills
234 Opponent First Ball Stops
(755 + 437) / (755 + 437+ 666+ 234) = 0.57
So you can dominate First Ball by Killing a ton of balls, Stopping (Block or Opponent Errors) your opponent a bunch, or some combination of the two.
Let’s break down the sub-components and see some of the other leaders from this season.
First Ball Share Leaders
Here’s the teams where First Ball was the biggest part of their matches:
Looking at the share of rallies played in First Ball is more of a stylistic than a skill element. You see some teams that were really terminal up there, but you also see some teams like DePaul that were really low serve-error. If you’re low-Terminal Serve, you’re more likely to be high-First Ball. This is also skewed a bit toward teams who blocked a lot of balls- Louisville, Pitt, Oklahoma, etc.
And here’s the teams where First Ball was the smallest part. We’ll generally see teams here that were higher-Terminal Serve (Aces and Errors), a little less terminal offensively, and teams that relied more on digging than blocking.
Again, this a bit more stylistic than skill, although we know from an overall level of play standpoint that higher levels of play have high FB Share, and we’ll see that this holds true within a level of play as well… although more loosely.
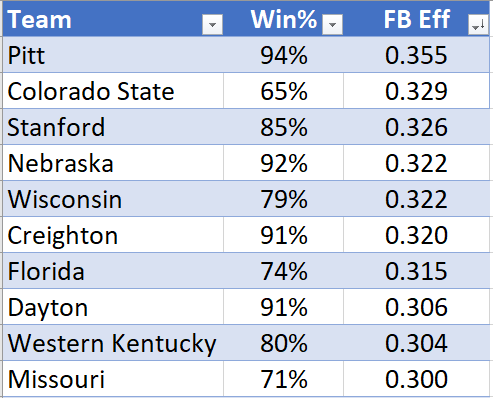
First Ball Efficiency Leaders
No surprise to see many of the most successful teams in the country on this leaderboard. Most of these teams were among the leaders in First Ball Differential, which makes sense.
0.300 Efficiency in First Ball is a tough standard to meet, and odds are you have a shot to make a deep playoff run if you’re able to do it. Raising this number is a combination of:
Creating More In-System Opportunities
Attacking Effectively In-System
Attacking Effectively Out-of-System
Most of these teams are at least above-average in all 3 of those areas, although some of them rely more heavily on one factor than the others.
Opponent First Ball Efficiency Leaders
And here we have the other side of the coin: teams that were really good at stopping their opponents from scoring. Pitt, Dayton, Nebraska, and Creighton all ring the bell in both efficiency categories… no surprise that those were 4 of the top-5 in overall FB Differential.
There’s also a representation of dominant teams from smaller conferences; moreso on this list than the attacking list. This shows the effect of unforced errors in some of the smaller D1 conferences.
Next week I’ll bring in some scatter-plots and correlation and see how these components compare influenced winning and losing.


