Related:
Serving Profiles
Digging Profiles
Articles in this series:
Part 1 - Introducing The Data
Part 2 - Stuffmasters
Part 3 - The Funnelers
Part 4 - Touchy-Feely
Touchy-Feely
Here’s the ten teams who were relatively the best at getting touches on the block, relative to the other aspects of blocking.
Quite a bit of variance here between the teams, we have Kentucky and Pepperdine with only 1 conference loss as well as a few teams closer to 50% conference Win %. Let’s go into the correlation math now.
Winning And Losing
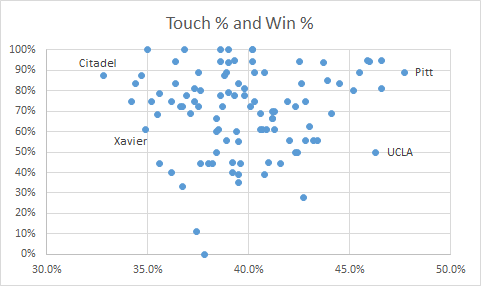
There’s very little correlation between getting a lot of block touches and winning and losing. The correlation was only 0.07, which is sufficiently low that I would say, “there’s no correlation.” Now remember, that doesn’t mean getting a lot of touches is bad either. No correlation means: there doesn’t seem to be a clear relationship, one way or the other, between Touch % and Win %. To visualize, here’s a scatter-plot.:
You have Pitt (among others) with a great conference Win % and super-high T%, but then you have The Citadel and others with really low T% but also great Win %. And then you have Xavier and UCLA with low and high T% respectively who were more in the middle of the pack when it comes to Win %. Just simply put… not a lot of relationship one way or the other. But more on that later.
Let’s look at the other correlations I pulled that specifically relate to blocking:
0.16 - Stuff %
0.07 - Touch %
0.38 - Error %1
0.35 - Block:Error Ratio
Other Correlations
There’s not a correlation between T% and Win%, but does that mean that getting block touches is unimportant? Kind of, but kind of not. Remember the Knockout Serving Profile?
Serving Profiles - Part 4
This fall we’re looking at the factors that contribute to success on the defensive side of the ball: Serving, Blocking, Digging. The first part of this content block will focus on serving. I’m analyzing data from the top-100 RPI teams of the 2023 NCAA Women’s volleyball season. For a full introduction to this study, check out Part 1.
Sometimes looking at macro-level correlations is helpful and sometimes it can be a little confusing, so it’s always worth zooming in and zooming back out. Again, what we’re looking for here is information that’s going to help us train our team.
So let’s look at 2 additional correlations:
-0.09 - Touch % to Error %
0.71 - Touch % to Stuff %
Those are both pretty interesting to me!
First of all, I would have guessed that Touch % was correlated to Error %. If teams are getting a ton of touches, shouldn’t they get tooled more? Apparently not! Technically there’s a slight negative correlation, which means that teams that got more block touches got tooled a little less, but it’s low enough to effectively call it 0. Let’s look at the scatter-plots here:
You can see the lack of relationship there. Teams on the left had very few touches (with Citadel being the lowest) and teams on the right had the most- with Stanford at #1. Teams at the top (Villanova, Colorado, etc) got tooled the most and teams at the bottom (Rice, Creighton, etc) got tooled the least.
Now let’s look at the relationship between Touch % and Stuff %:
Now this relationship is pretty clear. The teams with more touches (x-axis) also stuffed more balls (y-axis). Citadel, the lowest-touch team was right on the line, and Pitt was both highest in Stuff % and Touch %. I also highlighted a couple examples of teams off the trend. For example, South Carolina was quite a bit above the line, which means they stuffed a lot more balls than their touches would predict2. On the flip side, Pepperdine had a high Touch % but a relatively low Stuff %. Hence, you see Pepperdine in the list of teams with the high-Touch profile.
So what does this mean for me as a coach?
Here’s the conundrum: Stuff % correlates more with winning than getting touches. But players don’t get very many stuffs, compared to touches. So it might be valuable for coaches to track total touches, because it’s a reasonable proxy for the effect you have as a blocker. For example, the rate at which you give up aces as a passer is probably more impactful than your Good Pass %. But Reception Error % is a slower stat, it takes a little longer to accumulate. So sometimes Good Pass % is the more useful number when you’re dealing with a sample of dozens of receptions, rather than hundreds.
Touch % correlates to Stuff %, which correlates to Winning. So even though Touch % isn’t a valuable statistic in a macro team-wide sense, it has value for you as a coach. And that links up with common sense, right? A player than can get more touches probably has, at least, the potential to become a good blocker than a player who can’t touch anything.
We’re getting close to the end of this series of articles. I hope you’ve enjoyed them!
In the next couple weeks I’ll drop some more case studies related to the profiles I’ve been writing about and answer some questions in mailbag format. Then, in November, I’ll transition into some juniors club-related content as we get close to that time. Drop some questions in the comments and I’ll hit them in the next mailbag!
Technically it’s a negative correlation, because fewer errors = more wins, but I think it’s just easier on the eyes to absorb them as positive correlations.
And indeed, South Carolina was third on the “Stuffmasters” profile in Pt2.


