Alternate Passing Profiles
Is it better to Pass Good or to Not Pass Bad?
Webinar Reminder
This Sunday (May 26) at 8pm New York Time I’ll be hosting a webinar for Premium Subscribers. This will be a module from my Offensive Concepts seminar. I’ll present some of the reception systems I use in my offensive system and show you how to set them up. If you can’t get to a live event, this is a great time to become a Premium Subscriber and get access to this webinar. The link will get sent out to Premium Subscribers later this week. Don’t miss out!
The past 2 weeks I’ve started my main piece of summer content, which I’m titling Offensive Profiles.
Passing Strength
Passing Weakness
In-System Attacking Strength
In-System Attacking Weakness
Out-of-System Attacking Strength
Out-of-System Attacking Weakness
Balanced
I analyzed teams that had a Passing Strength or a Passing Weakness. When I did so, I analyzed them through the lens of Good Pass % or In-System %. This isn’t the only way to analyze passing, but it’s a good way. The more often you can pass a ball well, the better you are at passing. Seems reasonable.
Yet, there might be a little more to the puzzle than that. I’ve pointed this out in games like Aceball, but I think that there’s two different aspects to quality passing:
Passing the ball accurately.
Don’t get aced.
These two aspects are related but not completely overlapping. I bet most of you reading this might accept that one passer might be a bit more accurate when she gets her platform on that ball than another passer, but also might give up a few more aces over the course of a season. Maybe she reacts a little slower and gets beat on a short serve. Maybe she communicates poorly and gives up an ace in the seam. Whatever the reason, it seems at least possible.
So, let’s put some numbers to it!
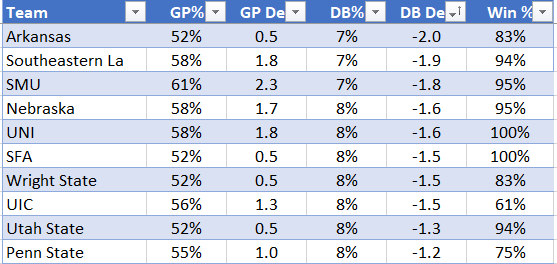
Above are the 10 teams with the lowest Dead Ball %1. In DataVolley parlance this is R= and R/ or, in normal human language, means direct aces, overpasses, or shanked passes resulting in giving the other team a free ball.
What do I notice about this group?
First, we see that there’s an imperfect correlation between DB% and GP%. If you look at the GP Dev category, all of these teams are positive, meaning they are all above-average Good Pass Teams. A few of them, such as SELU, SMU, Nebraska, and UNI, are among the top GP% teams in the country. That means they both allowed very few aces and passed in-system a lot.
But there’s also teams like Arkansas, SFA, Wright State, and Utah State who are right at 0.5 GP Dev (Good Pass Standard Deviations), which means they were above-average, but barely so. This shows that there’s teams who might not be in-system quite as much as the most accurate passing teams in the country, but yet were very good at preventing aces/overpasses/shanks.
Now let’s look at the bottom-10 in DB%.
Again, a similar feel to this chart. Ohio State and Northwestern, for example, have GP Devs near -2, meaning they were near the bottom of both GP% and DB%. But you also have teams like Wake Forest and South Carolina there, who were closer to average in GP%, but allowed a lot of aces/overpasses/shanks.
Indeed, the comparison of Arkansas and South Carolina is probably worth looking at in more detail.
The most significant difference between these two teams was in Dead Ball %.
Arkansas was 1.0 deviations better in GP%, they were 0.3 deviations worse in In-System Attack, and 1.3 deviations better in Out-of-System Attack. But they were full 3.5 deviations better in preventing Dead Balls. And then Arkansas ends up at 15-3 and South Carolina 5-13 in the same conference.
Overall, the correlation between GP% and Win% was 0.47. And the correlation between DB% and Win% was -0.542. This means that preventing aces (and shanks, and overpasses) actually had a stronger correlation with winning than passing accurately.
Let’s look at the relation between GP% and DB%.
Here we see the clear relationship: as teams tended to give up fewer dead balls they tended to pass in-system more often. Teams that are below the trendline (such as UGA, Drake, Arkansas) were better at preventing aces than they were at passing in-system. Teams that are above the trendline (such as Wake Forest, Oregon, Stanford) were better at passing in-system than they were at preventing aces.
Overall, the correlation of these two aspects of passing was about -0.6, meaning they are related, but, as you can see in the chart, imperfectly related.
Takeaways
It’s pretty simple to me: ace prevention and in-system passing are two related-but-separate aspects of passing. If you want your team to be good, you should probably work both of these areas.
And, if you want to see some pieces of how I do this, don’t forget to make sure you’re on the Premium Subscriber list and join the webinar this Sunday at 8pm eastern time.
Technically, the 10 teams with the lowest Dead Ball % among top-100 RPI teams, but it’s likely that close to 0 teams outside of the top-100 would have made this list.
Negative because more DBs is a bad thing, so you win more when you DB less and you win less when you DB more.


Are past webinar recordings available?