Beach Week: World Champs Triangles
This week is Beach Week at Smarter Volley. I dedicate the first three weeks of each month to indoor volleyball and the fourth week to the beach game. If you are purely here for indoor volleyball, you might want to skip this one.
The theme of the next 3 Beach Weeks is Winter Wrap-Up. Each week I’ll take a look at 1 of 3 major championships: FIVB Men’s World Championships, FIVB Women’s World Championships, and the NCAA National Championship. In particular, I’m looking at what the Triangle relationships were in these different competitions and seeing if we can draw any trends.
2022 Men’s World Championship
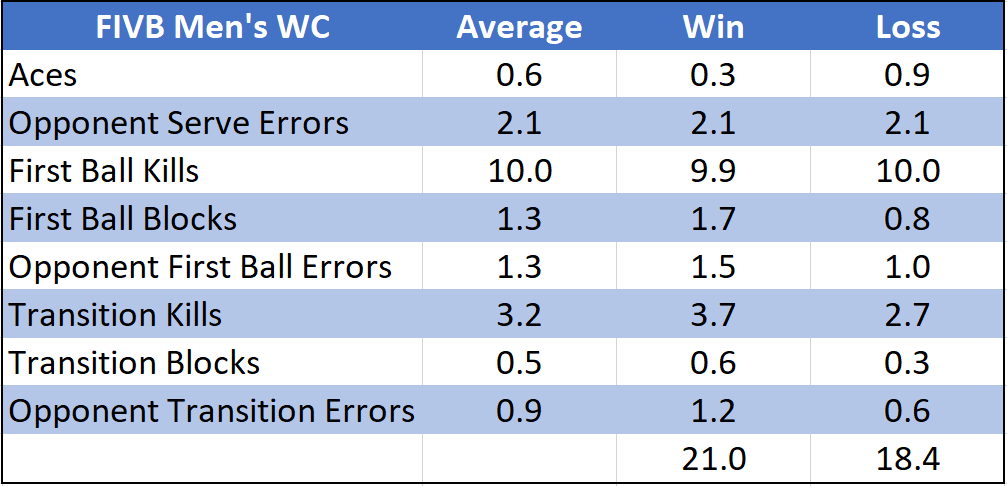
First, let’s look at the numbers.
A few notes about these numbers:
This is a per-set basis, but I stopped when a team reached 21, because I wanted to keep that frame of reference. So there’s a few in the data set where a team won 21-20.
I only included sets that were 21-17 or closer. I wanted to keep the analysis to close sets, to see where the thin margins of victory were.
Everything here is from round-of-16 onward.
With that, let’s turn to the pieces of the Triangle.
Terminal Serving
Terminal Serving did not appear to be a major differentiator between winning and losing teams. The losing teams, on average, served more aces, and earned more Terminal Serve points overall: 3.0 to 2.4.
Losing teams missed serves at a slightly higher rate (they missed 2.1 serves out of 18.4 while winning teams missed 2.1 serves out of about 20.5) but that doesn’t appear to be the difference between winning and losing.
Winning Teams Serve-In Rate: 89.8%
Winning Teams Ace Rate: 1.5%
Losing Teams Serve-In Rate: 88.6%
Losing Teams Ace Rate: 4.9%
Average Serve-In Rate: 89.2%
Average Ace Rate: 3.1%
As with any beach competition, you have to take court conditions into effect. Regardless, winning the Aceball game didn’t appear to be critical to winning a World Championship in Rome.
First Ball
Here we see some difference between Winning and Losing Teams.
12.6 Average First Ball Points
13.1 Winning Team First Ball Points
11.8 Losing Team First Ball Points
1.3 Average Winner-Loser Differential
Interestingly enough, the difference was less about killing the ball and more about First Ball Stops, with the losing teams actually earning slightly more First Ball Kills than the winning teams, but the winners gaining more than a point per set advantage in stopping the opponents.
Let’s look at that more closely though, because we know that losing teams receive serve more, so they have more opportunity to FBK. Let’s look at it on a % basis.
64% Winning Team First Ball Kill
55% Losing Team First Ball Kill
So on the % basis, winning teams were quite a bit more terminal.
18% Winning Team First Ball Stop
12% Losing Team First Ball Stop
We’ve seen this pattern before on the indoor side. The data doesn’t clearly support one of First Ball Kill or First Ball Stop being more important than the other. Dominant First Ball teams can be good by killing the ball or stopping the opponent from killing the ball. Nothing revolutionary there.
Transition
Here’s where things get interesting:
4.6 Average Transition Points
5.5 Winning Team Transition Points
3.6 Losing Team Transition Points
1.9 Average Winner-Loser Differential
Despite Transition being a relatively smaller part of the game, there was a bigger gap between winning teams and losing teams in the Transition phase of the game. It’s pretty surprising that the could be a 2-point gap when only 9 points, on average, per set were played in Transition. That means that winning teams won over 60% of Transition rallies. Compare that to the other two phases:
Winning Teams Won:
44% of Terminal Serving Points
52% of First Ball Points
61% of Transition Points
By far the biggest gap was in the Transition phase. Of course, there’s some confounding factors here. Winning teams serve more, so the losing team gets more chances to FBSO, narrowing that gap. And since winning teams serve more, they have more rallies where they have the first chance at Transition, giving them an advantage in that phase.
But… I selected for close sets. We’re talking about serving 20.5 times1 vs 18.4. That's a difference, but not a huge difference. Plus, even though winning teams winning in Transition has a bit of a tautological element, it still rings true for training: if you want to win a championship, you probably need to win the Transition battle.
About half the time the set ends with a sideout.


