(Belated) Beach Week: The Paper Trail
From pencil-and-paper to AI and computer vision, all in 1 (3?) article.
Note: Apologies to everyone who was expecting these Beach Week articles last week. I had a little miscue with the scheduler1 and none of these got released. Whoops. So now instead of sending all 3 of these articles out and jamming up this week with 6 emails, I’m putting all of the Beach Week into this article and putting it out and the end of the week. So this ends up being a mega-week of content. Also, the In-System Offense Webinar is this Sunday (tomorrow, if you’re reading as this is released) at 8pm Eastern Time. It’s only for Premium Subscribers, so now is a great time to upgrade if you haven’t yet!
Final note: This article is basically 3 articles in 1, so it might be a little long for your email. You can always click on the headline and read in your browser.)
This week, I’m making theme less of a specific technical aspect and more on your process as a coach and analyst. I sometimes talk about the latest technology or various in-depth and esoteric statistics. But I think one of the reasons that people like SmarterVolley is that I try to ground all of this in my origin story as just a guy from Delaware who started devising systems to coach better in my local area.
Let’s talk analytics and how you want to study the results of a match.
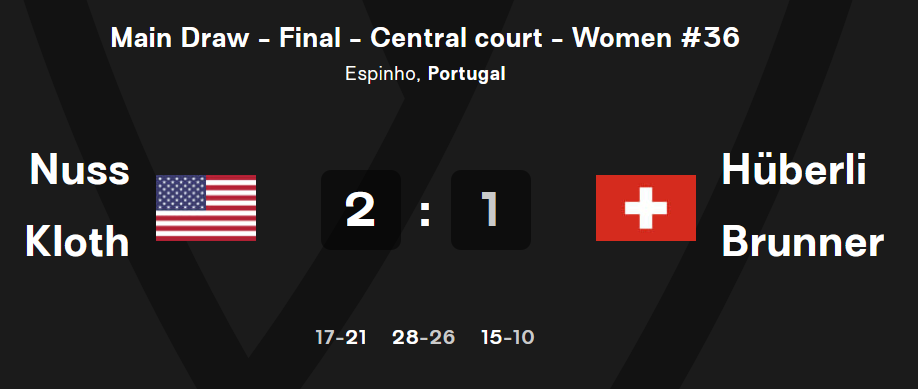
As a case study and a chance for go-USA homerism in an Olympic year, I’ll use the recent Elite16 event where Nuss and Kloth took home the win over the Swiss pair.
One of my basic principles is:
anything you want to do with advanced analytics, you should be able to start doing with pencil and paper.
I read a quote somewhere sometime that was something like: “automation makes a good process better and a bad process worse.” According to the internet, that quote was either by Bill Gates, Albert Einstein, Abraham Lincoln, or Michael Scott.
So, let’s get out our trust pencil and paper and do the most basic, Level 1, pencil-and-paper analysis. This is the Terminal Contact Sheet. What this means is that we’re only going to record the winning point of a rally. The cool thing about this one is that there’s no judgment involved.2 You either won the point or lost the point. We’re not grading pass quality or anything. So a student/parent manager can be trained to do this pretty easily.
Additionally, because you only mark the last contact, this stat sheet can be kept by a head coach who wants to keep her eye on the game and what’s going on, and not have to put her head down to record each dig or attack attempt, etc. Of course, for you beach coaches out there, you might only have a head coach for multiple pairs, so efficiency becomes even more important.
Here’s what the setup of this sheet looks like:
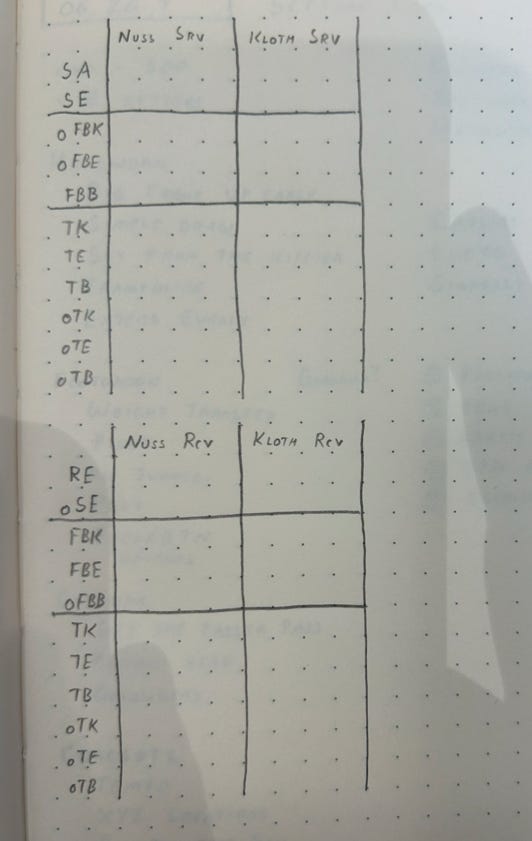
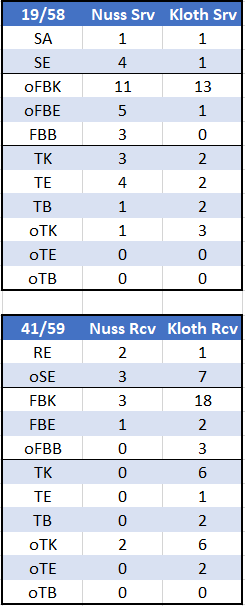
The left-hand column abbreviations are, as follows:
SA = Service Ace
SE = Service Error
oFBK = Opponent First Ball Kill
oFBE = Opponent First Ball Error (unforced)
FBB = First Ball Block (you blocked the opponent)
TK = Transition Kill
TE = Transition Error (unforced)
TB = Transition Block (you blocked the opponent in Trans)
oTK = Opponent Transition Kill
oTE = Opponent Transition Error (unforced)
oTB = Opponent Transition Block (they blocked us in Trans)
RE = Reception Error
oSE = Opponent Service Error
FBK = First Ball Kill
FBE = First Ball Error (unforced)
oFBB = Opponent First Ball Block (they blocked us in First Ball)
So the top section indicates when we’re serving and the bottom is when we’re receiving. Each section is split based on which player is serving (or receiving) and those sections also divide into 3 groupings, which correspond to The Triangle.
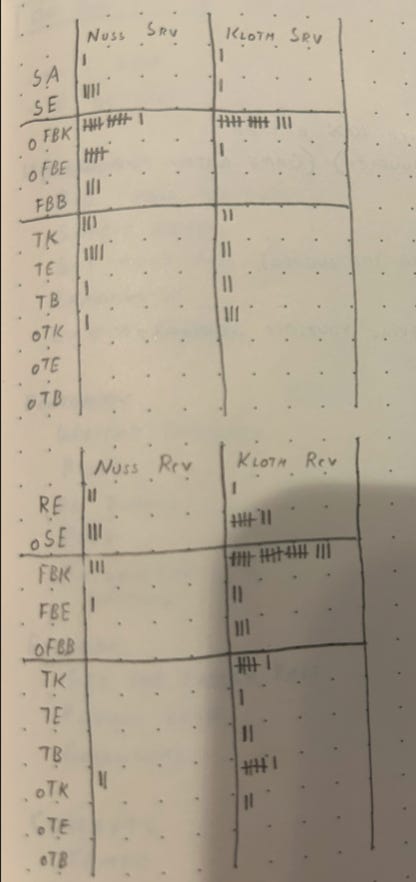
Okay, let’s see what it looks like after this is all filled out…
There’s something kind of fun to pencil-and-paper stats, isn’t there?
I show it that way because this is how you might keep these stats if you’re coaching a beach pair and you don’t have access to some of the advanced tools that are on the market to capture statistics live. You might just be rolling it out there with your notebook and doing the best you can. The cool thing about that is: you can still get pretty far like this!
This could be done in real-time, without detracting from your ability to watch and follow the action. All you needed to do was to record the last point of the rally. I did this off video, which is nice because you can skip through the dead time, so it took less than half of the time that the actual match took.
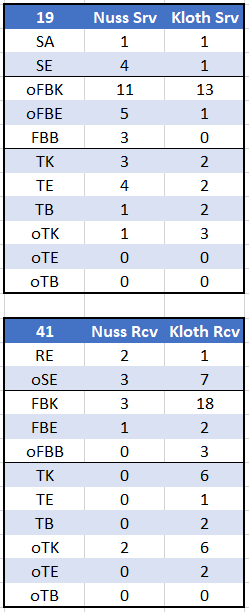
Now, let’s transfer these stats from our notebook into a spreadsheet on our computer:
Okay, so first of all, if you add up all of the numbers there, you get 117, which is the total number of points scored by both teams. Whew, we didn’t screw up! Next, the “19” and the “41” are how many points Nuss/Kloth scored in each phase. They scored 19 points when they were serving and 41 when they were receiving. Whew, that matches the 60 total points they scored in the match. Again, we’re in the clear.
Producing The Triangle
Okay, so we have these stats, what do we do with them? Well, the first thing we can do is translate them into our Triangle. We get:
+4 Terminal Serves
12 - Nuss/Kloth (2 Aces, 10 Opponent Serve Errors)
8 - Opponents (3 Aces, 5 Nuss/Kloth Serve Errors)
+/- 0 First Ball
30 - Nuss/Kloth (21 FBK, 3 FBB, 6 oFBE)
30 - Opponents (24 FBK, 3 FBB, 3 Nuss/Kloth FBE)
-1 Transition
18 - Nuss/Kloth (11 TK, 5 TB, 2 oTE)
19 - Opponents (12 TK, 0 TB, 7 Nuss/Kloth TE)
And again, everything adds up nicely. Nuss and Kloth won the Terminal Serves by 4, held even in First Ball, and lost the Transition game by 1. That adds to a 3-point margin, which matches their margin of victory.
And really, you can kind of think of that Transition game as being essentially even. We win by 2 in volleyball, amirite? We talk about trying to win 2-out-of-3 points of the Triangle, the same way we need to win 2-out-of-3 sets of volleyball. But this was more of a case of 1 win + 2 ties = Match Win.
Again, the great thing there was that all this information can be gathered on pencil-and-paper without a dedicated stat taker. And with no tools. I did put this into a spreadsheet, but you could easily just add those tally marks up right there in your notebook and have the information immediately.
Next, we’ll go beyond the base Triangle layer and get a few more statistics.
Sideout and Opponent Sideout
Previously, we pulled the Triangle statistics, using our simple pencil-and-paper recordkeeping. We can get Sideout and Opponent Sideout information as well. I’ll make a slight chance to the spreadsheet so you can see:
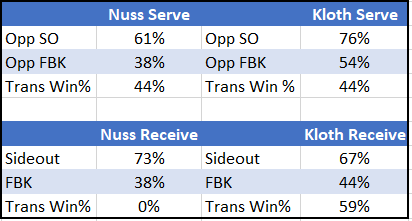
Before I just had “19” and “41” in the top left of each half, but now I included the denominator. What this shows is that Nuss and Kloth scored 19 “real” points on 58 serving chances, or their opponents sided out 39 times on 58 chances. And Nuss and Kloth sided out 41 times on 59 chances. Or, put into %s:
69% - Nuss/Kloth Sideout
67% - Opponent Sideout
We expect a very similar number because the match was so close. Over the course of 1 match, these numbers don’t really tell us anything that the raw numbers don’t tell us. But over time, we know that Sideout % can tell us not just the margin of victory but our relative strength on the offensive or defensive side of the ball. We can also calculate First Ball Sideout.
36% - Nuss/Kloth FBK (21/59)
41% - Opponent FBK (24/58)
And now we get another good piece of information. The Swiss team was more terminal in First Ball, but also made more errors. Nuss and Kloth weren’t especially high-kill (36% is a fairly ordinary number at this level) but they controlled the ball well and didn’t make errors. If we back up one step to simple Make Them Play:
88% - Nuss/Kloth MTP (43/49)
85% - Opponent MTP (45/53)
Not a huge separation, but Nuss and Kloth kept more balls in play. If they had a Transition advantage, they could have won the match by more, but the Swiss team was quite good in Transition, which negated a bit of the Nuss/Kloth MTP advantage.
Finally, we can turn the Transition points into %s and divide them by which player served or received:
49% - Transition Win% (18/37)
44% - Nuss Serve Transition Win % (4/9)
44% - Kloth Serve Transition Win % (4/9)
0% - Nuss Receive Transition Win % (0/2)
59% - Kloth Receive Transition Win % (10/17)
These are all fairly small samples, so you’re going to pull more information out of this over time. Kloth was by far the serving target of the Swiss (she was targeted 48 out of 59 serves), so her ability to produce “good zeroes” mattered a lot in this match.
Let’s wrap this part up by putting all this info into the format of Beach Rotations and see what that looks like.
This starts to give us some individualized information, but is still team-oriented. In order to take this beyond, we need to use some fancy technology.
Enter: Balltime
I’ve written about Balltime before, but I haven’t been this excited about a piece of tech since Pocket Radar or something like that. I’ve gotten a lot of mileage out of DataVolley and even written a manual3 on how to learn and use it. But DV is difficult to use on the beach and the cost and time-to-learn is a huge barrier for coaches outside of the elite-of-the-elite programs that can afford to hire dedicated statisticians.
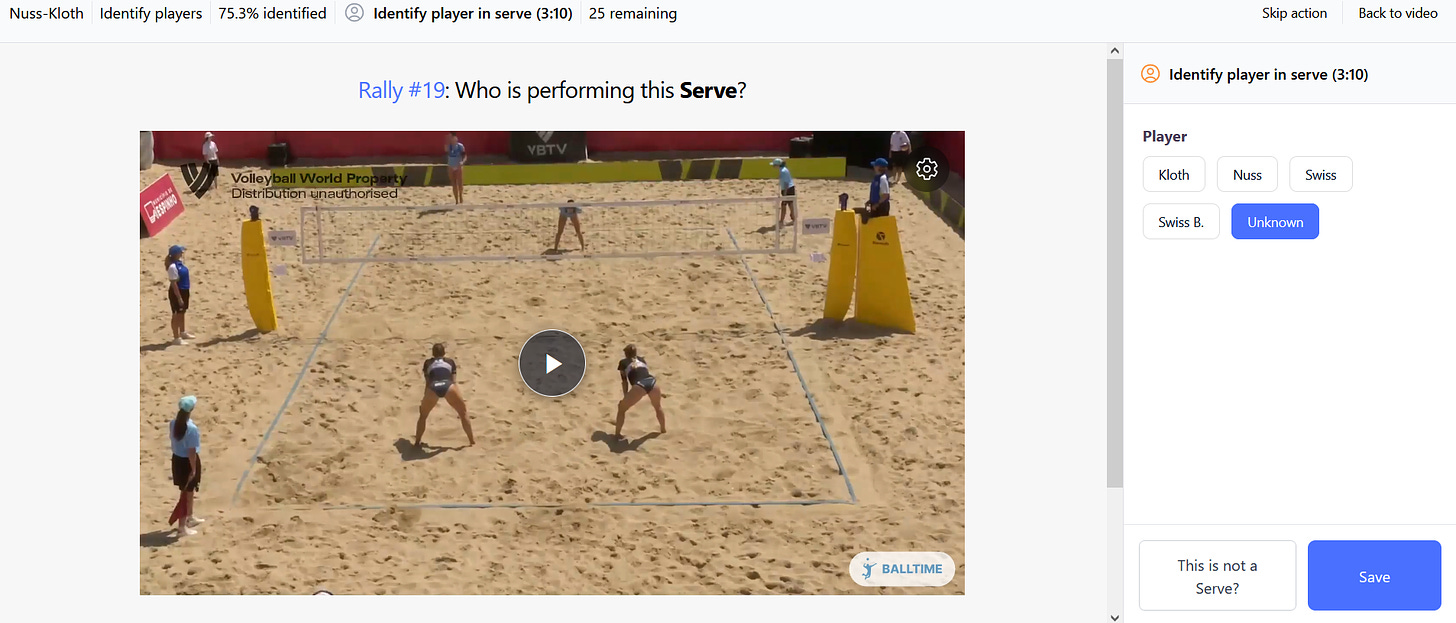
I do like some of the stuff that Hudl does where they will code the matches, but the prices start to get pretty steep and the turn-around time is more like 24 hours. When you upload to Balltime, you get your tags back within an hour, sometimes quite a bit less than that. Balltime uses computer vision and AI to identify which player performed the action, and what kind of action it was. The better your video and the better your angle is, the better. I’ll do some tutorials on this app in the future, but typically if you upload decent video, you’ll get something like this:
So you can see there that Balltime matched a player to an action 75% of the time. Pretty good, and if you’re just looking to watch the video for the purposes of clips and giving feedback to your player, you’re pretty much set.
In fact, for a juniors beach coach, or even just the parent of a juniors beach player, this combination of:
Last-contact stat sheet on pencil-and-paper.
Quick balltime upload to watch most of your actions
Is probably the biggest bang-for-your-buck combination of stats + video you can get. Comparing to what the elite programs are doing, you probably get 80% of the way there.
The Next 10%
But let’s not stop at 80%, amirite? As you can see above, the first pass through the computer vision ids 75% of the contacts4. It took me about 20 minutes to run through all the unidentified contacts. I might be a touch faster than you, but it’s pretty quick. If you do that, you can now get some individual statistics:
This is a good compliment to our pencil-and-paper stats, which give us that team-wide scaffolding of The Triangle, but lack individual statistics. There’s some good info here, but we’ll see it’s a bit incomplete. For example, Balltime has Nuss and Kloth at 6 combined attacking errors, but we saw from above that there were 10 total errors, between FB and Trans, in our Last Contact sheet. Now, those could also include setting errors, but we only have 1 setting error in the above stats. So there’s 3 missing errors.
Like we said, we can use the pencil-and-paper + Balltime with little-to-no additional work to get 80% of the way to peak analytical power, but we’re going to need to do some work to wring out the last 20%. I started by filtering Attacks with “Unknown” result. There were 20 Attacks where Balltime tagged the correct player but didn’t record the result. Almost all of these attacks were the type of rally that Balltime’s computer vision struggles with - blocks/jousts on tight sets, balls that were attacked and then overdug, balls that were kinda-dug-but-then-they-made-an-error, balls that were attacked and dug but the blocker made an error, etc. Once I edit those (this took about 10 mins), I get this as the Balltime attack stats:
Nuss: 8 kills, 4 errors, 22 total attempts
Kloth: 19 kills, 6 errors, 47 total attempts
What’s interesting is that the FIVB Stats on Volleyworld are quite a bit different and in fact, are way off. Whoever uploaded the match stats on Volleyworld has Nuss at 8 kills, 2 errors, and 2 continues5, which would be only 12 total attempts. However, Balltime has Nuss at 22 total attempts, and I rewatched every one to verify. There’s clearly 8 kills by Nuss, clearly 4 errors, and clearly 22 total attempts.6 So kind of strange that the FIVB is so far off. They also have Kloth at 26 kills, 11 errors and 26 continues, so I can only assume their statistician is giving quite a few Nuss attempts to Kloth.
The Last 10%
We’re up against the Substack email length limit, so we’ll cut it off here and save some space for future articles. I also want to bring this back to the original point of this post: the idea of scaffolding. By starting with pencil-and-paper and adding layers of analysis as we have the resources, we can do 2 things:
Provide a consistent base for both our coaching and our players that will always be there.
Add additional information as we find it useful and as time/money/staff/player investment permits.
With just pencil-and-paper and operating in real-time, we come away with useful Triangle information for our team. By spending a few minutes in Excel, we can add to that. By spending a few more minutes uploading to Balltime, we can add the video layer. By spending 20-30 minutes editing tags, we can now start getting individualized statistics, which isn’t easy to do on the beach.
Stay tuned, I’ll be showcasing more of what you can do with this technology in future posts.
This miscue was: I forgot to schedule them and left them in drafts.
Kind of, I’m going to throw a little in there when we look at block/defense.
Free for Premium Subscribers! Drop me a comment and I’ll send it to you if you don’t have it yet.
There’s some ways to get that number higher, I’ll talk about that in another article.
FIVB calls these “Attempts” which is a little confusing as most coaches think of Attempts as “Total Attempts” so I will use “continues” or “zeroes” to mean “attempts in which there was neither a kill nor an error/block and the rally continued.”
It’s possible that there’s more as I did not rewatch every single contact and it’s possible Balltime miscoded something. But I didn’t see any contact miscoded between Nuss and Kloth, so I’ll assume there were close to 0 attempts miscoded and I’m going to assume that the 8-4-22 split is within +/- 1 of being exactly correct.



Whew that was a lot! Great content, thanks for checking your drafts!