Winter is here, which means club volleyball season is here for juniors volleyball coaches in the USA. Therefore, much of my content right now is tailored for club coaches. In the past, these have been some of my most popular posts. Check out this summary post which has links to last year’s Club Winter posts.
If you’re not a club coach, don’t worry! Although this article series is tailored for club coaches, the topics apply more broadly, to coaches at any level. I think you’ll still find some insights in here. Also, stay tuned in upcoming weeks for analysis of the NCAA Women’s tournament.
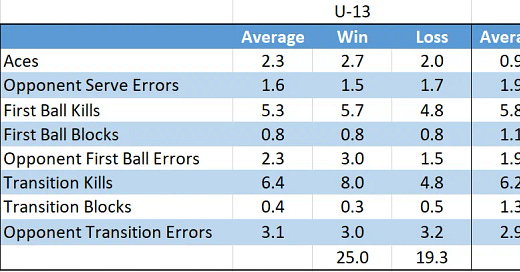
I’ve previously shared some analytics on club volleyball from 3 different age groups. Follow the link if you want to see the full break-down, but here’s the big chart:
These help us form an idea of what The Triangle looks like for club volleyball. Although, keep in mind that this is data from medal-round matches at Nationals, so they are representative of the top level of play in those ages and not the average. A few takeaways from that analysis:
Serve 2 aces or more. Miss 2 or fewer serves. Give up 2 or fewer aces.
You can see that this is basically true, both in aggregate and also as a difference between winning and losing teams. If you can do these 3 things, you’ll have a nice edge in Terminal Serving that can help make for a successful season. It is VERY DIFFICULT to give up fewer than 2 aces per set in juniors club volleyball. Generally speaking, serving runs well ahead of passing. But we see here that the better teams are able to do it.
We also see these teams generally missing in the range of 1-2 serves per 25-point set. That’s another area where teams give points away. We also saw that, even in top-100 NCAA Women’s Volleyball, Serve-In % had a surprisingly-high correlation to winning. Teach your kids to serve the ball in and not give up aces and you’ll be surprised at how far that will go.
We also see evidence of The Flippening here in this chart. Even in medal rounds, at U-13 and U-15, there are more Transition Kills than First Ball Kills. By U-17, that has changed. As I mention in my Offensive Concepts seminars, a high portion of those transition kills at the younger levels (even for good teams) come from:
Free-balls and down-balls
Tips and junk
Medium speed, medium angle swings
A lot of defensive training is done by focusing on making the most difficult defensive plays. And it’s understandable, preventing kills is part of winning. But those digs don’t often lead to transition kills. A lot of times, in those situations, you’re just keeping the ball alive and Making Them Play. Most of the actual transition points are from the 3 scenarios listed above.
Some New Data
I’m compiling some new data on club volleyball. This can be a difficult task as there’s not a big repository like Volleymetrics for club volleyball. Plus, my full-time coaching jobs for the past 10+ years haven’t been in club volleyball. What I’ve been able to do is reach out to some coaches and start compiling match data from club volleyball. My data-set is far from complete but I’m starting to import video into Balltime to analyze.
I’ll also share some of the data I’m using, starting with U17/U18 medal-round matches from both US and Canadian Junior National Championships. Since I’m coaching a U17 team this year, this is relevant to me.
Sideout and Earned Sideout
Balltime does give you some overall Sideout data. For those of you using Balltime (or getting it as a Christmas gift!), here’s how you look at that data:
You go in the Stats tab and then go to Rotational stats, where you can start to sift through this. You can see, in this match, this team had a Sideout % of 57%. Now, it doesn’t directly show you Opponent Sideout, but it does show you Scoring Efficiency. This number shows the Total Number Of Points. If you subtract out, you get the number of points you scored as the serving team. And take the inverse of that to get Opponent Sideout.
Sound confusing, it’s not too bad. Let’s walk through it.
61 / 122 = “Scoring Efficiency”
34 / 60 = Sideout
27 / 62 = Scoring as the serving team.
If you scored 27 out of 62 points when serving, it means the other team scored 35 out of 62 points when receiving.
35 / 62 = 56%
So the winning team sided out at 57% and the losing team at 56%. But it’s actually even closer than that, since 34/60 = 56.7% and 35/62 = 56.5%. Basically the same! Which… makes sense since both teams scored 61 out of the 122 total points in the match.
So if you’re using Balltime, you can instantly access your Sideout % and then get your Opponent Sideout with a couple of calculations. Pretty simple.
Earned Sideout
The difference between Sideout and Earned Sideout is simple: Earned Sideout eliminates service errors from the equation and focuses only on sideouts that you earned when the ball was served in. Both stats have their uses, although I tend to focus more on Earned Sideout in girl’s club volleyball.1
In this case, all you need to do is click over to the stats tab and look up the serving errors. Here’s what that looks like:
Keep reading with a 7-day free trial
Subscribe to Smarter Volley by Joe Trinsey to keep reading this post and get 7 days of free access to the full post archives.


