First Ball Data Dump
I like numbers. Not everybody does. If you don’t like numbers, this might not be the post for you.1 Most NCAA numbers are courtesy of Volleymetrics, but some are from my own research. Also, if you want to learn how to dive deeper into the numbers, check out the DV4 Manual that Jeff Liu and I put together.
I’ve been talking a lot about First Ball Team Profiles. I looked at a First Ball Strength profile:
As well as a First Ball Weakness profile:
Check them out for some more background on this stuff. Now, here’s some selected stats from Power 52 conference leaders, with some commentary on what I think it might mean.
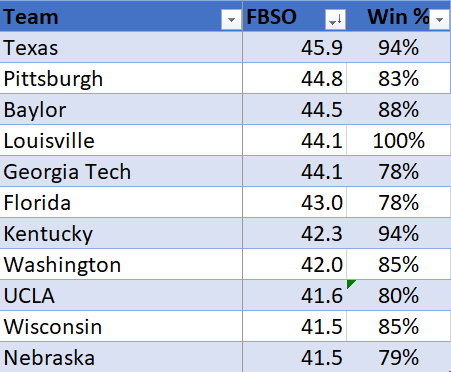
FBSO
Clearly, First Ball Sideout is well correlated to winning. The whole Final Four is here and 6 of the top-83 to boot. The correlation between FBSO and Win % was 0.87 in the Power 5 this year. Pretty strong!
Also interesting that 4 of this top 114 profile not as a First Ball Strength team but a Terminal Serving Weakness. These teams were Texas, Georgia Tech, Kentucky, and Wisconsin. Remember that a TS Weakness profile really means, “much more dominant at the net than in serve-pass.”
As I said in this post:
These 3 ways of looking at the success of the Terminal Serving Weakness profile show us that it’s not a bad thing to have. In fact, there’s a pretty good argument that, in NCAA women’s volleyball, you might be well-served by spending less resources trying to get good at Terminal Serving relative to First Ball and Transition.
There’s probably some evolutionary pressure involved here. In order to hit and block at the highest level in the NCAA, you need to be way out on the right tail of height and jumping ability. It’s probably a tautology that the group of 99.999th-percentile spike touch athletes are going to be worse servers than the mere 99.9th-percentile spike touchers.
Based off that, it’s not surprising to see Wisconsin, likely one of the tallest teams in NCAA volleyball history, in this group. When you’re selecting that skewed of a physical profile, just getting them to be merely average servers and passers is probably going to make you a really good team.
Worth thinking about.
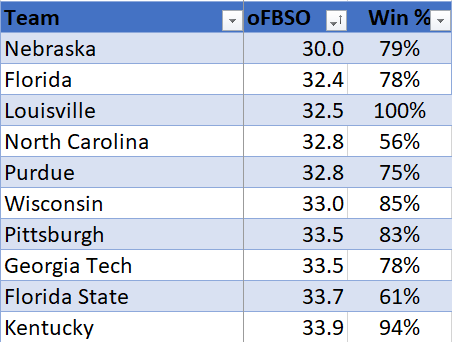
Opp FBSO
No surprise to see defensive stalwarts Nebraska atop this list. There’s a 0.76 correlation between preventing Opponent FBSO and winning. That’s big, although a bit smaller than the FBSO stat.
Also interesting that it’s much the same crew. 7 of that 11 are represented on this list. In fact, the correlation between the two sets is 0.62. So both scoring in First Ball and preventing opponents from doing so are highly correlated to winning, and fairly highly correlated to each other.
File those statements to the Department of Obvious Department, but it’s good to put some numbers on it. Okay, let’s torture the data a little more and see what we get.
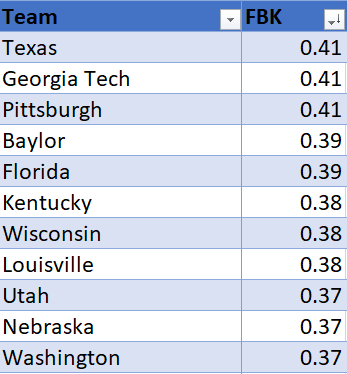
First Ball Kill
Terminology starts to get a little wonky here, but what I’m doing here is essentially Kill % on first ball attacks. FBSO is, “did you side out,” which includes service errors (you sided out) and getting aced (you didn’t). Whereas this is skipping past the past to look at kill % assuming there wasn’t a Terminal Serve. It’s arguably5 a bit more pure of a way to look at First Ball ability than FBSO.6
What’s interesting is that the correlation only drops a hair. So if I just look at how well a team kills the ball when they get an attempt out of serve receive, that predicts winning almost as well as adding in the reception.
I’d like to get a project going to compare this effect to FIVB volleyball. My guess tells me that the sub rules allow NCAA Women’s team to play a net-heavy brand of volleyball that blunts the effect of serve-pass a bit. You could also argue there’s a meta-game effect here. The top few teams (who are good at everything, just better at a few things) happen to prioritize an aspect of the game, which could skew things. In two years, Wisconsin might be rolling out a smaller lineup7 of 6-rotation players and winning via serve-pass.
Now let’s look on the defensive side of the ball:
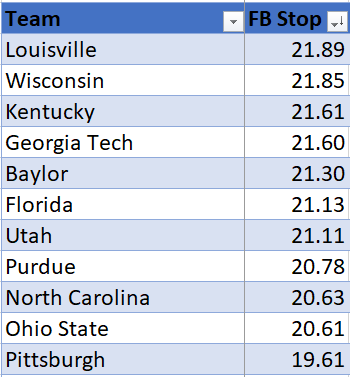
First Ball Stops
This is, “what proportion of opponent attacks are blocks and errors?”This stat is mostly measuring blocking, although there’s a big element of “serving tough” (because errors increase as pass quality declines), and maybe an element of intimidating your opponents into errors.8
So yeah, not surprising to see this collection of teams. Interesting that Nebraska was #1 in preventing opponent FBSO, but not in the top-10 here. They weren’t far off, at #12, but you can see their profile of defensive excellence skewed more toward serving and digging than blocking.9
I was trying to hack my way into a metric that would compare which teams were most reliant on blocking for their proportion of FBSO but I haven’t found a compelling way to do it that didn’t result in a really contrived nonsense number.10 Any ideas? Drop them in the comments.
Okay one final one.
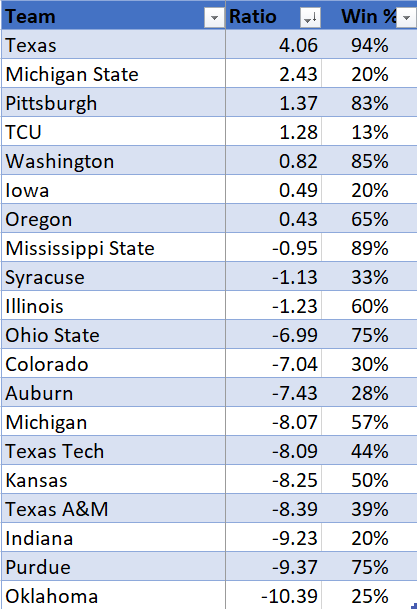
Offense:Defense Ratio
What was that about nonsense stats? The number by itself doesn’t mean anything; it’s just an index because I couldn’t figure out how to do anything better.
But it does tell you something. The higher the number, the more relatively offense-reliant you were in First Ball. The lower (deeper into negative) the number, the more relatively defense (stop) reliant you were in First Ball. This chart shows the top-10 and bottom-10 in this metric respectively.
The correlation here ended up being effectively zero. There were good teams that were offense-reliant and good teams that were defense-reliant.
But it does speak to the meta-game that there were a higher proportion of elite teams at the top than the bottom. It’s also worth noting that there were 3 First Ball Strength and 0 First Ball Weakness teams at the top and 0 First Ball Strength and 2 First Ball Weakness teams at the bottom.
Remember, that this is just a ratio of offense:defense, not a, “you’re a better team,” metric. The correlation to winning is zero.
So my takeaway there is that teams emphasize offense more than defense. If it were the other way around, we would see some First Ball Strength teams at the bottom, that got dominant in First Ball via block/defense while having a relatively mild offense. That doesn’t appear to be the case.
Is that a fluke of this year, or an overall trend? My guess is that it’s an overall trend. Of all readers here, how many of you practice defense more than offense? Drop me a comment with your thoughts.
I mean, if you really don’t like stats at all, you probably think this whole blog sucks and I’m very confused as to how you got here.
Sorry BYU!!
Missing Purdue and Minnesota, two teams oriented more toward Terminal Strength.
Wisconsin and Nebraska were tied so I figured I’d include them both.
The lower you go, the more setting errors and “miscommunications leading to non-attacks” make an impact on the match. At the NCAA P5 level, those become a rounding error.
As you might notice, the numbers are lower across the board, because teams get aced less than their opponents miss serve.
Haha good one Joe!
If you believe in that sort of thing.
Or specifically: blocking for points. Control blocks will show up as affecting opponent FBSO but not as First Ball Stops.
Not that I don’t make up enough of those anyway…


