

Sandy Sunday: Diagnostic Panel Part 1
A Triangle update for the beach
NCAA Beach season kicked off with a great start last week at the Outrigger Classic. I say great because my beloved LMU Lions went 5-1 including a first-ever win over the mighty USC Sandy Trojans. “Nobody beats LMU 36 times in a row.”
After a winter of being immersed in indoor volleyball, it’s so fun to watch all these matches and just see all the different team pairings with different styles and tactics. Using analytics for beach volleyball is interesting because it’s both (a) more difficult to collect the data and more difficult to compare relevant teams and build standards of comparison and (b) easier to customize and tailor things for a team of only 2 players instead of 12. This means that coaches who can use analytics properly on the beach can give their players a nice boost.
I did a 2025 Triangle Primer for the indoor side, so consider this the equivalent for the beach side. If you’ve read every SmarterVolley since the beginning, you might be familiar with a lot of this, but there’s probably still something new.
Diagnostics Panel
When I produce an analytics report for beach volleyball, part of it is this “diagnostics panel” where I can see the broad strokes of how this team scores and allows points. It looks like this.
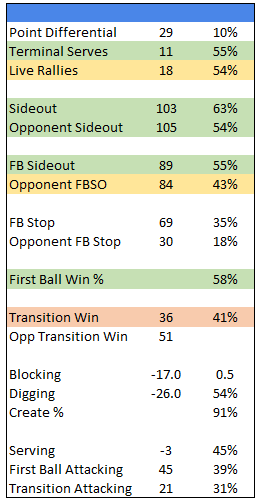
If you’re familiar with The Triangle analytics method, a lot of these terms will be familiar to you. This was from a fall weekend from one of the LMU pairs and includes 6ish sets of volleyball1. Here’s some of the stuff I look at and why:
Point Differential
This team was +29, which equates to a 10% Point Differential. That’s a team that had success over the weekend. You’ll win something like 80% of your matches in indoor with a 10% Point Differential, but in beach it will likely be a bit lower due to the best-of-3 format. But also, 10% Point Differential is within the bounds where analytics are useful. At a 20% Point Differential (negative or positive), you start to get into territory where the games were so skewed that the numbers you get aren’t too useful.
Terminal Serves and Live Rallies
In the Triangle I separate the two different kinds of Live Rallies: First Ball and Transition. I do that in this diagnostic as well, but I also like to see this pair right up front. To me this is the, “does this team need extra serve/pass work” diagnostic. This team was pretty much equally strong in both phases of the game.
One note here: they were +11 in Terminal Serves and +18 in Live Rallies, but the Terminal Serving % was higher, because there are a lot more Live Rallies (at least at the NCAA level) than there are Terminal Serves. I like having both the raw and % to check.
Sideout And Opponent Sideout
The raw numbers are going to be approximately the same here2 but the %s will vary. This team earned a Sideout % of 63% and Opponent Sideout of 54%. The median sideout at this level is in the ballpark of 59%, so this team was about equally good offensively (siding out) and defensively (stopping opponent sideout).
That’s an important diagnostic for me, because it helps steer coaches toward feedback, player attention, and drill design. If this team had a Sideout of 58% and Opponent Sideout of 49%, they would be just as successful, but with a different strengths/weaknesses profile. Likewise if they had a Sideout % of 68% and Opponent Sideout of 59%.
FBSO and Opponent FBSO
Similar to the above analysis, but just with a focus on FBSO. If a team is very strong in FBSO and not as strong in overall Sideout, then they are losing points within the rally. That’s actually the case here. This team was a good sideout team, but they were an incredible FBSO team. And now see below:
First Ball And Transition
Now, within the Live Rallies, we separate out how good a team was at winning the First Ball battle and how good they were at winning within Transition rallies. And we see here this team had a clear weakness in Transition.
We also see that a big edge in the First Ball was also stopping their opponents (either aces, blocks, opponent errors) in First Ball.
Translating To Training
I’ll unpack more of this diagnostic panel in the next installment, but you can already see how using some of this simple information leads to conclusions for designing training. Just based off a few takeaways for this team, you might:
Use some next-ball inputs. For example, every time they win a rally with a First Ball Stop, you immediately toss a ball in deep that the defender has to play and the blocker has to hit over on-2. And then continue the rally from there. Do it so it’s hard to kill that ball, so they end up having to win more rallies in Transition, especially “coming from behind” a bit.
A bonus-scoring game where you get a bonus point for winning a rally in Transition.
Raise the net up a bit, which will likely create some longer rallies.
Those are 3 potential tweaks you might make to the gameplay section of practice, and there’s obviously some takeaways in terms of more structured drills or technical training. You might notice something about how they set in transition or take approaches, etc, and do some technical work there. But the stats aren’t going to necessarily tell you that automatically; they’ll raise the question and then you as a coach need to use your eye to connect the technical piece.
Spring is in the air here in coastal NC and I for one am ready to get out on the sand a little bit. How about you?
It’s beach volleyball and it’s fall, cameras get bumped and not fixed for a few points, they get started a couple points late, etc.
In a given set of volleyball, both teams sideout either the same amount of times (if the serving team wins the set) or within 1 of each other (if the receiving team wins the set). The point differential is in the Break Points.