
Sandy Sunday: Diagnostic Panel Part 2
More beach Triangle
NCAA beach season is underway. As you read this, teams are in their third weekend of competition for the year. I consult and do statistical analysis for beach teams. This series of articles will unpack my process of analysis.
I did a 2025 Triangle Primer for the indoor side, so consider this the equivalent for the beach side. If you’ve read every SmarterVolley since the beginning, you might be familiar with a lot of this, but there’s probably still something new.
Diagnostics Panel
When I produce an analytics report for beach volleyball, part of it is this “diagnostics panel” where I can see the broad strokes of how this team scores and allows points. It looks like this.
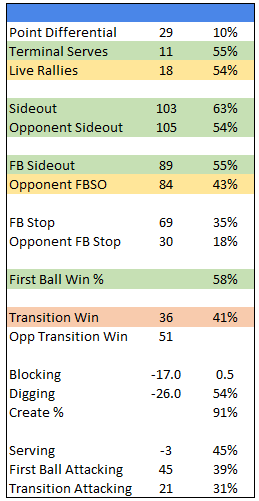
If you’re familiar with The Triangle analytics method, a lot of these terms will be familiar to you. This was from a fall weekend from one of the LMU pairs and includes 6ish sets of volleyball. Last article I unpacked:
Point Differential
Terminal Serves + Live Rallies
Sideout + Opponent Sideout
FBSO + Opponent Sideout
First Ball + Transition
FB Stop and Opponent FB Stop
This is not one of my primary analytic tools, but I like to have it. In this calculation, FB Stops are Aces, Blocks, or Opponent Errors. It’s similar to MTP, but it also includes blocking your opponent. Basically, what you can see here is that this team only had to dig a ball on 65% of their serves. 35% to 18% is a pretty extreme gap.
In this example, part of what this tells me is that their defense and transition game didn’t get stressed a whole lot, because they were stopping their opponents so frequently.
Blocking
There’s a +/- and a ratio here. The +/- is just the raw number of blocks - blocking errors. Before you wonder why that number seems skewed, let me introduce a concept called Primary Responsibility that informs how I evaluate block and defense. I touched on this a little bit in an indoor-focused article, and I’ll run through briefly here.
I pair every opponent kill with either a Blocking Error or Digging Error. Sometimes these are obvious. Blocker is in the net or gets tooled? Blocking Error. Rollshot right at a defender who shanks it? Digging Error. Sometimes they aren’t so obvious. Hitter hits a clean shot past the block that catches the endline. Blocking Error or Hitting Error? If you’re on the defensive team, you of course object to either. “Hey, that was just a good hit!” And to an extent, yes that’s true. But the most objective and informative way to evaluate defense is to say, “on that given shot, who was most responsible for allowing the kill? Who had primary responsibility?”
There’s some judgement here, especially in doubles. Is the line shot attributed to a defender who could have ran it down, or a blocker who allowed a flat shot past them? I’ll unpack that more in the future, but just understand that’s the concept I’m using for this number.
This team had a 0.5 Block Ratio, which means they had 1 block for every 2 block errors. That’s not bad in NCAA Beach Volleyball. That equates to a 0.333 Opponent Efficiency on balls that involved the blocker. Most blockers in the NCAA are below 0.6. A block ratio of 0.67 means opponents only had a 0.200 efficiency on balls that involve the blocker. You’re winning a lot of games like that.
Digging
Similar concept here. There’s an overall +/- here, as well as a ratio. In this case, I award the defender a 1/2 point for a dig, rather than the full point I award to a block stuff. The +/- isn’t too big of a deal, but I think there’s some usefulness in comparing the +/- between blocking and digging. This is more of a level check, but I view it as a little bit of a diagnostic on whether, as a coach, you want to be putting more of your effort into coaching the block or defense.
Digging also includes a % number. And again, this isn’t going to be “% of digs they shanked” because many kills in beach volleyball land clean. So there’s plenty of, “they went the wrong way on a shot and didn’t even touch it.” In this case, 54% is okay, but not outstanding. 4s and 5s will generally dig a little higher than that. If you’re playing 1s and your blocker likes to stay and block a lot, 54% isn’t bad.
Create %
This is (Transition Attempts) / (Digs). Over 90% is fine to me. Under 90% might raise an eyebrow. But sometimes really scrappy teams have lower Create % because they are getting difficult balls up. Or windy days might be harder to get swings in transition, etc. This is not a stat I’m dogmatic about, but it’s just something that might raise a flag with me.
There’s also been a few teams where their dig numbers were pretty good, but their create numbers were consistently low. And basically I raised the question to their coaches, “would you be willing to sacrifice a couple digs in order to get better swings in transition?” In this case, maybe that team needs to run some more 3s… if you run early to the line and dig it, you almost always get a swing. A number isn’t going to tell you that one way or another, but it might raise a flag for you to go dive back into the video.
Serving
Again, there’s a +/-, which is Aces - Errors. Very few teams serve more aces than errors, so this tends to be negative. The % is Knockout %. I look at that for the individual players, but sometimes it’s convenient to have it for your team.
First Ball and Transition Attacking
+/- here, which you sure hope is positive. Players tend to have more kills than errors or times blocked. And the % is efficiency. Again, I have these numbers for each player, but the team combination is handy to have too. This team, like most NCAA beach teams, scored significantly more points in First Ball than Transition. I don’t have an opinion about which number should be higher, but if a team is scoring a lot more points in FB than Trans, I probably want my training to reflect that… most of the entries should be live serves. That’s just a reflection of level of play.
In the next installment, I’ll unpack some additional metrics I like to look at- taking each partner individually now.