Sideout By Pass Quality Pt3
The hard part
Other articles in this series:
Sideout by Pass Quality Pt1
Sideout by Pass Quality Pt2
In the past couple weeks we’ve examined the concept of Sideout By Pass Quality.
I discussed analyzing In-System Offense as well as Medium Pass or Semi-System Offense. Today, we’ll look at analyzing your Out-of-System Offense.
What Is OoS Really?
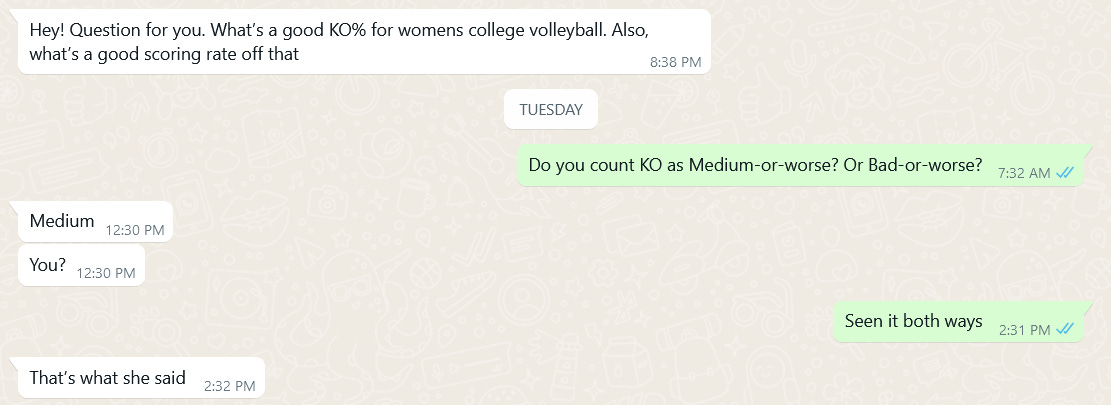
First of all, defining your terms is important. As a recent text exchange with a coaching friend went:
I’m a big fan of Knockout %. I’m pretty sure I invented the term, although certainly not the concept. The question is, how do you define Out-of-System? I used to count it as Medium-or-worse, but, as I mentioned last week, I like to treat Semi-System (Medium Pass) as a completely different animal from both In-System and Out-of-System. I think at some levels of volleyball (for example, U-15 juniors), you can actually just roll Semi-System up into In-System, because the sideout %s are almost the same.1
But we’ll talk the higher-level concept here, and I think it’s worth separating Semi-System from In-System. It’s also worth separating Out-of-System from Semi-System, because the whole context of the offense is different.
In Semi-System offense, you’re still expecting the setter to set the ball. And many teams might still (a) force the ball to the middle from 11’ and/or (b) run tempo to the pins from 11’. Whereas in true Out-of-System situations, it’s more likely that your setter is bumpsetting at best, or else a non-setter is setting the ball.
So How Do We Analyze Out-of-System Play?
The usual stuff still applies. Teams can and do still kill the ball Out-of-System. In the 2021 Men’s FIVB season, teams still killed the ball about 37% of the time after R- and the sideout was still over 50%. At the Women’s FIVB, or Women’s NCAA level, you’re a bit lower than that, but you’re still looking at 30%+ and 50%+. So Kill % and Efficiency still apply here.
But we also want to look a little bit more at the bottom-end of hitter production, namely:
Do we even get a swing at all?
What are our errors like?
I’ve talked about Make Them Play plenty of times, but you have this idea of Make Them Play and Make Them Really Play. All teams have a certain number of “lost swings” in different situations. At the high end, you have FIVB teams on a Perfect Pass. Your lost swings rate is approaching 0. At the low end, you have U-14 teams on a Bad Pass. Your lost swings rate could be 50%!
For visualization, I created this scientifically-accurate chart:
What I mean by that is, when a U-14 team passes poorly (say, in the middle of zone 5: a meter in from the sideline and 6 meters off the net), half the time they don’t even get any sort of attack attempt other than a freeball/downball. That’s a “lost swing.” The pass was not a reception error, but no attack attempt happened.
Even teams at high levels lose swings.
This doesn’t happen often, but it’s non-zero for sure.
A lost swing could be a point directly lost or it could just result in a freeball/downball.
You also have errors, and more specifically, the type of errors. And this is where the level you are at really matters. At the juniors level, I like this hierarchy:
Times Blocked > Hits Out > Hits In The Net
Very few juniors teams are meeting this criteria, but most of the good ones are.
At the NCAA level, I’d like it to get to something like:
Times Blocked > Unforced Errors
Again, it’s a tough standard. Very few teams will meet it as a whole. Wisconsin was just off it (6.8% Es to 6.0% Bs) while Pitts (6.9% Es to 8.0% Bs) was there.2 USA in their Gold Medal-winning Olympic run was 6.1% Es to 6.9% Bs. Recent Men's World Champion Italy was 6.1% Es and 6.4% Bs.
This is a common theme: as teams get higher-level they first take the net of the equation (by hitting long rather than low) and then they take the sideline out of the equation by attacking the block rather than missing out.
So in conclusion:
Separate true Out-of-System from Semi-System.
Look at your Kill% and Efficiency, but also your lost swings.
Within your errors, decide what the bad errors and the acceptable errors and chart that ratio.
Anybody have examples of “acceptable error” and “bad error” that you’ve used with your teams? Drop them in the comments.
In fact, it’s common to see juniors teams sideout better on Medium Pass than Good/Perfect Pass.
Although, from an execution standpoints, you’d rather be 6.8 to 6.0 than 6.9 to 8.0. So I’m not saying it’s better, in a vacuum, to get blocked more. I’m just talking about the distribution of errors.


