Team Profile: Terminal Serving Strength
We’ve introduced The Triangle framework of analyzing teams and matches. We discussed Terminal Serves, First Ball, and Transition. Just knowing these three concepts gives you a starting point for translating information into action. The next step is understanding how these three aspects of the game interact and how they combine to form a Team Profile.
What Is A Team Profile?
Using The Triangle to create a Team Profile means to understand which of the factors are relatively strong or weak for that team. If you think about a team that is perfectly average in all three aspects, the triangle would be even on all sides. Equilateral, if you will. But if one aspect is much stronger than the other two, you can imagine that point would move away from the other two, skewing the triangle in that direction. Likewise, if one aspect is much weaker than the other two, you can imagine that point moving toward the other two, skewing the triangle in a different way.
Ultimately, a Team Profile is a visualization that helps coaches connect their teams strengths and weaknesses to what needs to be done in training.
What Do You Mean By Terminal Serving Strength?
A team with a Terminal Serving Strength is a team where their ability to score points (and prevent points) in the serve-pass aspect is significant stronger than their ability to score points once the rally begins. These teams will score points with their serve and not get aced often, but they aren’t dominant attacking and defending.
An important note is that this is relative to the overall strength of the team. For example, a team that is well below-average in First Ball and Transition might have a Terminal Serving strength if they are simply above-average in Terminal Serves, whereas a team that is above-average in First Ball and Transition needs to be outstanding in Terminal Serves for that aspect of the game to stand out.
How Do I Know If An Aspect Is A Strength Or A Weakness?
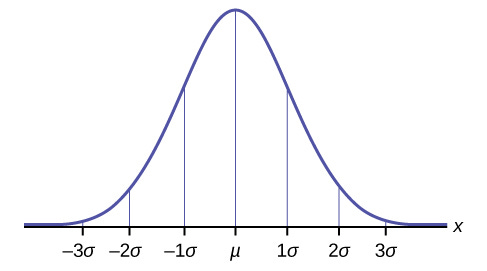
I define a strength as an aspect that is at least a half standard-deviation above the other two aspects. For example, a team that’s a bit above-average in Terminal Serves has a Terminal Serving strength if they are a bit below-average in First Ball and Transition.
Why half of a standard deviation? I don’t know, it seems about right to me.
But more importantly, it’s not even about the specific statistical quantification. If you’re a high school coach, you don’t know what the standard deviation is for all of these aspects- although I will share some data as we go. But most coaches have a sense for the strengths and weaknesses of their teams. Where do you seem to gain an advantage? Where you do seem to have a disadvantage?
Some teams are balanced. That’s informative as well. Don’t assume you team is clearly skewed in one direction without taking some time to think about it.
Also, don’t assume your team has a strength in an area of the game, just because you WANT them to have a strength in that area of the game. You may value scrappy defense and smart transition play, but it may not have translated into results on the court. Yet.
How Common Are Teams With A Terminal Serving Strength?
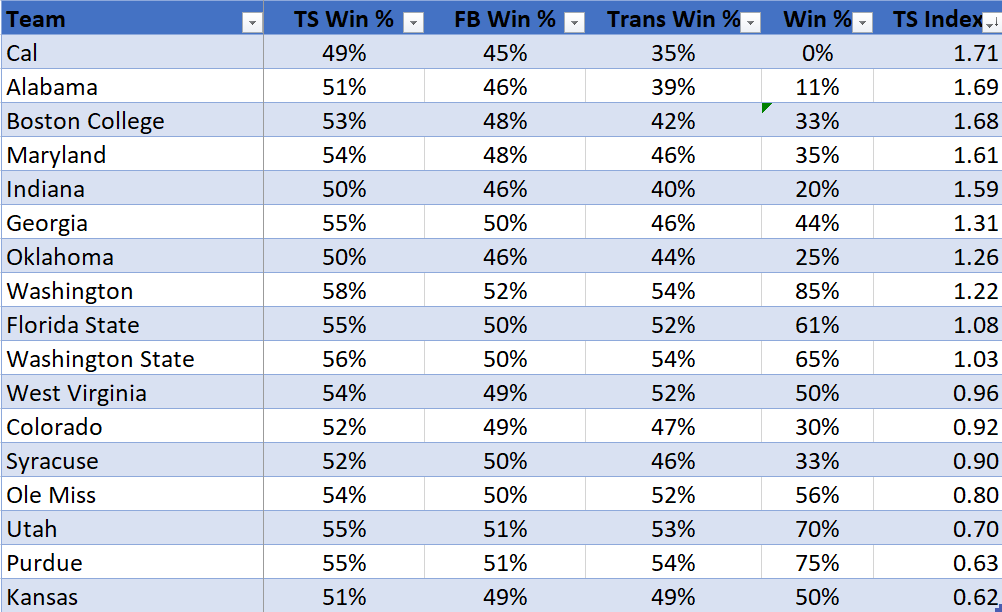
Of the 63 teams in this database1, 17 had a Terminal Serving Strength.2 That’s in the ball-park of 1-out-of-4 teams.
“Terminal Serving Strength” was actually the most common Team Profile among Power 5 schools. That makes sense; Terminal Serving is less correlated with First Ball and Transition than First Ball and Transition are to each other. That’s part of the purpose of the Triangle, to untangle these related-but-not-totally-related aspects of the game. So there’s going to be more teams that are noticeably strong or noticeably lagging in Terminal Serving than the two other two categories.
The last column there is what I’m calling “Terminal Serving Index.” So instead of using a somewhat arbitrary “Strength” or “Weakness” designation, you can see the gradient. The more relatively strong Terminal Serving is (compared to the other two areas), the higher the TS Index score.
If you’re curious, Minnesota was the next-highest team in TS Index, although they weren’t skewed enough in that direction to meet my cut-off of a Terminal Serving Strength profile.
How Successful Are Teams With A Terminal Serving Strength?
Included (conference) winning % in the above graph, so you can see that for yourself. If we’re using this (again, somewhat arbitrary) cut-off to form the profile of Terminal Serving Strength, the average winning % was 44%, the equivalent of going 13-17 or 14-16 over the course of a season.
A second way of looking at it is to correlation TS Index with Win %. The correlation in this sample was -0.22. Put another way, teams that were more skewed toward a Terminal Serving Strength tended to have worse records than teams that didn’t. But, 0.22 is a pretty small correlation affect. I think that’s closer to saying, “skewing your team toward a Terminal Serving Strength doesn’t affect winning or losing much in either direction,” than it is to saying that it’s actively bad to cultivate a strength in this area of the game.3
But so far, not a ringing endorsement of this profile.
A third way is to look at tournament success this year. Of the 18 profiles in the Sweet 164, 3 of them (Washington, Kansas, Purdue) were a Terminal Serving Strength profile. Since there’s 7 profiles5, that’s about proportional representation. You could also say that, given that there were 17 teams in the sample with a Terminal Serving Strength, and 3 of them made it to the Sweet 16, that, given that you’re a Power 5 team, if you cultivate a Terminal Serving Strength, you have an 18% chance of reaching the Sweet 16. This was less than any of the other profiles.
So What Do I Do If This Is My Profile?
Here’s my takeaways of this profile exercise:
Terminal Serving is inherently a more distinct skill. “Bad” teams can get good at it, and “good” teams can still lag behind in this area.
If you’re behind in the recruiting curve (relative to your level), Terminal Serving is probably a way of playing catch-up in the short-term. If you don’t have the size to be dominant at the net, you might need to be good here in order to be capable of competing at all.
Since a relative Terminal Serving Strength implies relative weaknesses in the other two areas, you probably don’t want to stay in this profile over multiple years; that would indicate that you’re struggling to recruit and train the other areas.
Washington is a powerful case-study. They were above-average in First Ball, good in Transition, and great in Terminal Serving. This put them at the top of a very strong conference and just a breath away from the Elite 8. If my team profiles as a Terminal Serving strength team, I’m studying what Washington did this year in order to maximize my success within that profile.
Later this week I’ll share some training implications, as well as a case study from the recent Tokyo Olympics. If you didn’t see the Q&A with Riley Salmon on passing, you might want to check that out as well.
Drawing here from Big 10, Big 12, Pac 12, ACC, and SEC. I’m also using some VM numbers to pull these a little faster than running separate .dvw analyses for every team. This is going to be slightly less-accurate than the more detailed numbers I provided in my NCAA tournament analysis, but it turns dozens of hours of research into just hours. I’m okay with that trade-off right now.
There are a few teams that have both a “strength” in one area and a “weakness” in another. In this case: Oklahoma and West Virginia had a First Ball Weakness, while Cal, Alabama, Georgia, and Syracuse had a Transition Weakness.
And reminder: we are talking about relative strengths and weaknesses. we will see next weak that Wisconsin profiles to a Terminal Serving Weakness, despite being an above-average Terminal Serving team in an absolute measure, because they were elite in the other two areas.
Okay, that’s a little confusing. First of all, BYU wasn’t in this sample because I only pulled from Power 5. (Sorry WCC!) But 3 teams (Nebraska, Georgia Tech, and Pitt) had “double-profiles.”
Terminal Serving Strength, Terminal Serving Weakness, First Ball Strength, First Ball Weakness, Transition Strength, Transition Weakness, Balanced


