
24 NCAA Triangles Part 4
FB Correlations
2024 NCAAW Season Analysis
Every year on SmarterVolley I have at least one content cycle that’s based around extensive statistical analysis of a large data set. American NCAA Women’s volleyball is pretty good at providing that, so I tend to pull heavily from data from the fall NCAA seasons, but some of the past analysis includes FIVB stuff, men’s stuff, etc.
2023 Defensive Analysis
2023 Offensive Analysis
2022 Major Competition Analysis
2021 Triangle Profiles
All of these have a similar flavor to them and I use many of the same tools, but I try to come at things a little differently each year so you won’t get bored and cancel your subscription can see some of the different methods of analyzing teams. Let’s dive into this year’s analysis.
Part 1: Terminal Serving Leaderboard
Part 2: Terminal Serving Correlations
Part 3: First Ball Leaderboard
Part 4: First Ball Correlations
Part 5: Transition Leaderboard
Part 6: Transition Correlations
Part 7: Strength/Weakness Profiles
Quick notes:
First of all, if you are unfamiliar with the Triangle analysis framework or some of the other terminology I use here, check our the Triangle Primer that I updated for this year.
Second, some details on the data-set: I used the top-100 teams in the NCAA and pulled all of their dvw files from all matches. I didn’t exclude any matches, so everything regular-season and playoffs is in here. Also, Drake is not in here, even though they were top-100 in NCAA. Every now and then a match won’t important properly into Volleystation but for whatever reason more than half of Drake’s matches didn’t important properly. So… nothing from Drake in here. Sorry about that folks.
2024 First Ball Details
Let’s go a little more into the sub-components of First Ball and Win%, as well as look at the correlations between them and winning.
First Ball and Win %
The correlation between FB Win % and Win % is 0.76. That’s no surprise there. First Ball points are over 40% of all total points. Additionally, as we’ll see in future installments of this article, being good in First Ball correlates to being good in Trans, so there’s some co-correlation there as well.
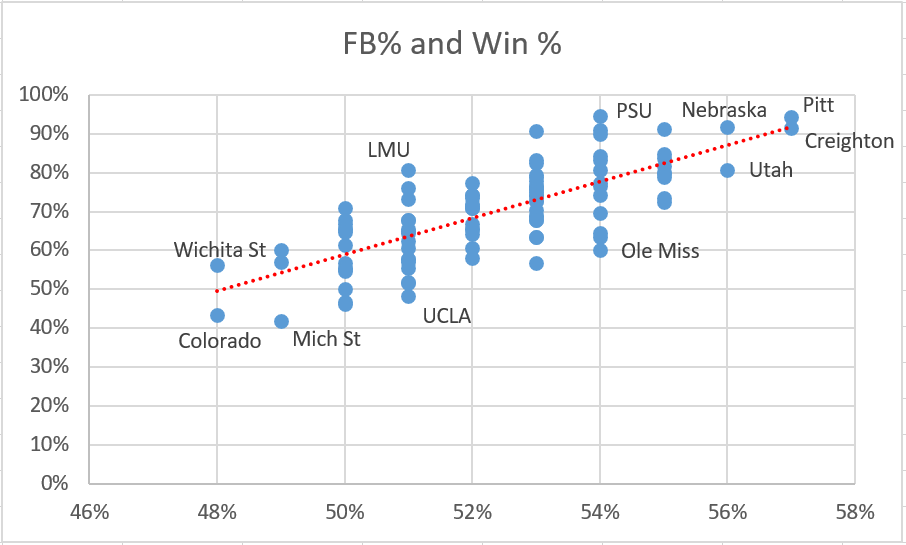
The trendline there is a solid fit that allows you to predict overall Win % off your share of First Ball wins pretty well. Every team that outscored their opponents 52-48 in First Ball had a winning record for the season. LMU was the only team under 53% FB who won 80% (if you play 30 matches, 80% is 24-6) of their matches. And you can see the round-of-16 and beyond drew heavily from teams there 54% or better in First Ball.
The other correlations were:
-0.13 FB Share
0.57 FB Efficiency
-0.69 Opponent FB Efficiency
Let’s take a look.
First Ball Share and Win %
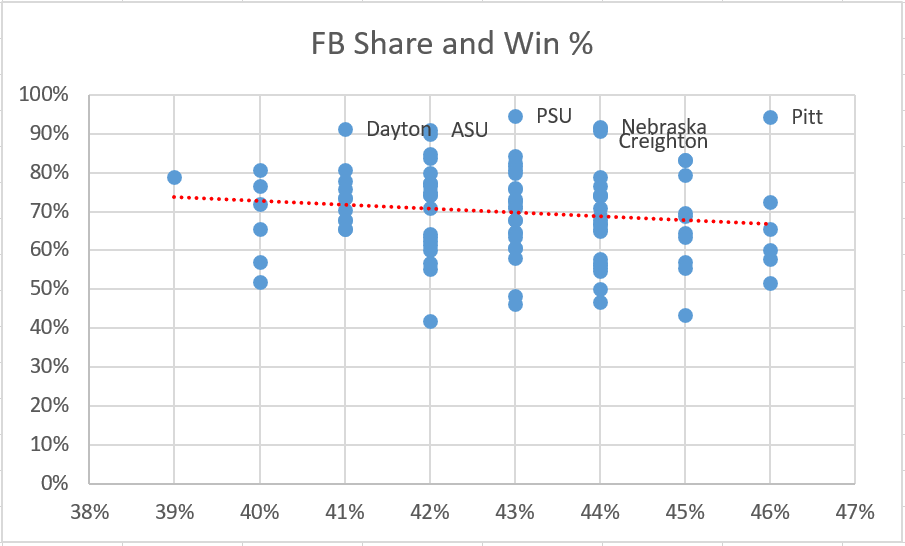
This is more of a novelty stat, but it is interesting that it had a slightly negative correlation with winning; indicating that teams that won more tended to play a bit less of the game in First Ball. I wouldn’t read too much into it. Pitt played tied-for-most share of the game in First Ball and they were one of the winningest teams in college volleyball. Dayton went 31-3 and played a below-average portion of the game in First Ball.
First Ball Efficiency and Win %
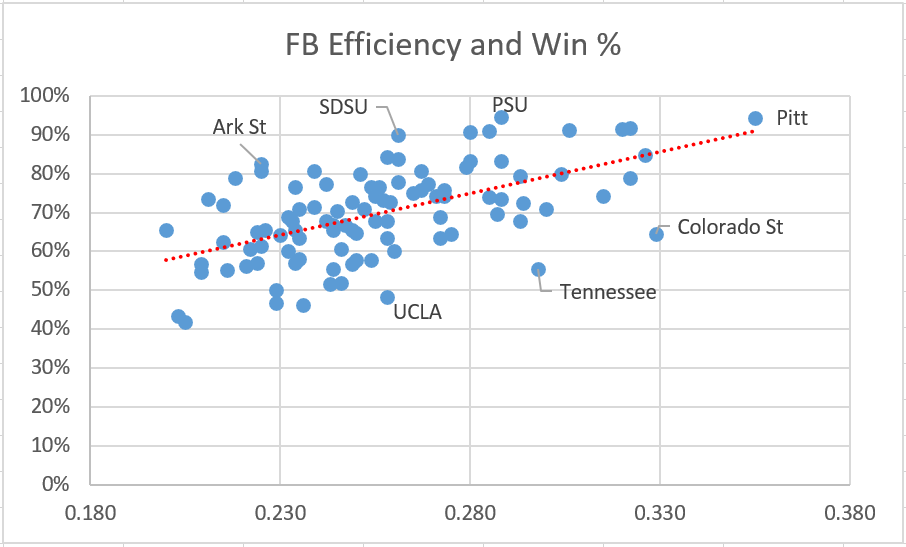
No surprise to see a fairly strong correlation here. You can predict overall Win % fairly well from knowing just your FB Efficiency. It was rare for a team to be at 80% Win % and below 0.260 efficiency, although you see a team like Arkansas St as a noteable exception. And most of the teams over 0.280 FB Efficiency were at 70%+ Win %, although you see Tennessee and Colorado State as noteable outliers to the downside.
Opponent First Ball Efficiency and Win %
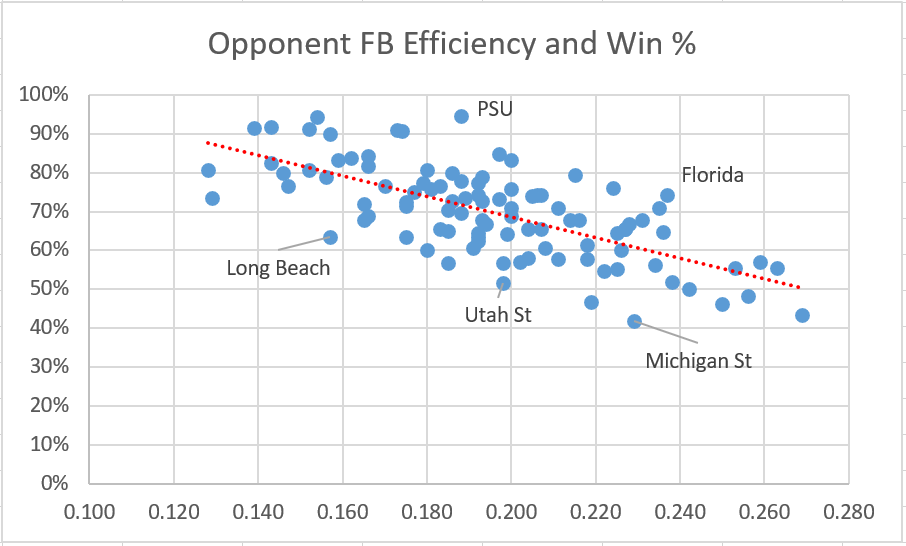
I was surprised to see that Opponent FB Efficiency had a higher correlation to winning that FB Efficiency.1 The spread here is tighter and there’s fewer obvious deviations off the trendline, but I highlighted a few here.
Takeaways
First Ball is a big part of the game. I’m shown in other analyses that it can be the decisive factor about as often as Transition, and generally more often than Terminal Serving. There’s no way around it: if you want to win at a high level, you need to be good in First Ball. And if you even want to get to a high level, you need to be good in First Ball, because the other teams at that level will be good at First Ball.
I wouldn’t read too much into Opponent Efficiency having a higher correlation to winning this year than your own correlation. Part of that could be that I selected only top-100 RPI teams, who tended to win a bunch. The lowest Win % in this sample was a 13-18 Michigan State team. Since this sample is biased toward teams who tended to win more than lose, that means I’m selecting teams who tended to serve more, which means their opponents actually tend to attack more than them. The winningest team in the sample, Penn State, had 300 fewer First Ball attempts than their opponents. Pitt had 500 fewer. If these teams, on average attack less in First Ball than their opponents (by virtue of serving more often), then it makes sense that Opponent Efficiency would correlate a little more.
Past studies I’ve done have tended to show a correlation about the same.
However, what I think this (and previous studies) shows, is that Opponent Efficiency must be at least comparable in value to your own efficiency. Certainly there’s not too much data that shows that it’s less valuable. Most teams (including my own) tend to value attacking a bit more than block/defense. It’s pretty common to see an NCAA D1 head coach who is the primary setting coach for the team. It’s less common to see a head coach be the primary coach of liberos or middle blockers.
I’m not sure I’m going to reorient how I organize practice based off one study, but looking through some of this data has made me think about the balance between offense and defense and what share of practice and coaching attention goes to each of those aspects of the game. Where do you stand on it? Drop a comment and let me know.
By order of magnitude. The correlation is negative because allowing a high opponent efficiency is bad.
Joe, how can I easily review our season from Volleymetrics and get our FB win%? Where are you pulling that number from?