
24 NCAA Triangles Part 5
The Transition Game
2024 NCAAW Season Analysis
Every year on SmarterVolley I have at least one content cycle that’s based around extensive statistical analysis of a large data set. American NCAA Women’s volleyball is pretty good at providing that, so I tend to pull heavily from data from the fall NCAA seasons, but some of the past analysis includes FIVB stuff, men’s stuff, etc.
2023 Defensive Analysis
2023 Offensive Analysis
2022 Major Competition Analysis
2021 Triangle Profiles
All of these have a similar flavor to them and I use many of the same tools, but I try to come at things a little differently each year so you won’t get bored and cancel your subscription can see some of the different methods of analyzing teams. Let’s dive into this year’s analysis.
Part 1: Terminal Serving Leaderboard
Part 2: Terminal Serving Correlations
Part 3: First Ball Leaderboard
Part 4: First Ball Correlations
Part 5: Transition Leaderboard
Part 6: Transition Correlations
Part 7: Strength/Weakness Profiles
Quick notes:
First of all, if you are unfamiliar with the Triangle analysis framework or some of the other terminology I use here, check our the Triangle Primer that I updated for this year.
Second, some details on the data-set: I used the top-100 teams in the NCAA and pulled all of their dvw files from all matches. I didn’t exclude any matches, so everything regular-season and playoffs is in here. Also, Drake is not in here, even though they were top-100 in NCAA. Every now and then a match won’t important properly into Volleystation but for whatever reason more than half of Drake’s matches didn’t important properly. So… nothing from Drake in here. Sorry about that folks.
Transition Leaderboard
Let’s take a look at the teams which led the NCAA in First Ball, both overall and in the various sub-components.
Transition Leaders
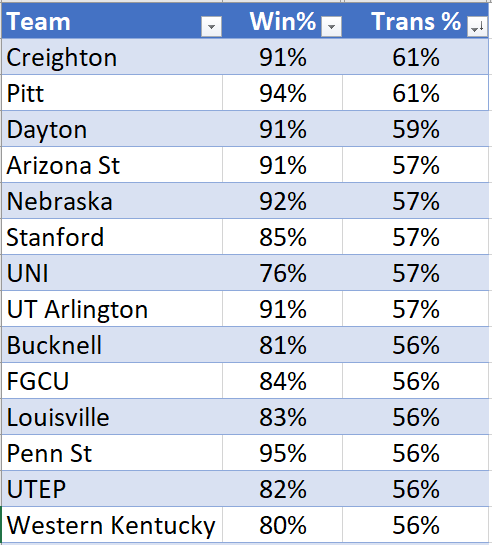
No surprise here to see so many of the best teams in the country clustered at the top. If you can win close to 60% of the Transition rallies, you’re going to dominate a lot of games. And if you read the playoff breakdowns, you can see that Transition success determined winning, to a large extent.
Let’s break down the sub-components and see some of the other leaders from this season.
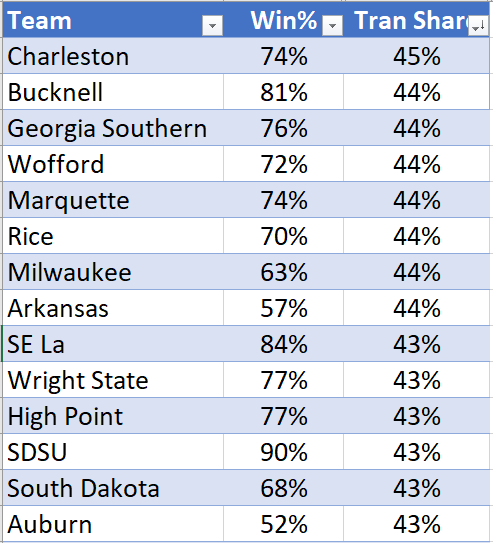
Transition Share Leaders
Here’s the teams where Transition was the biggest part of their matches:
… Here’s the teams that played the least in Transition. These teams were either high Terminal Serving (lots of aces/errors) or really terminal in First Ball.
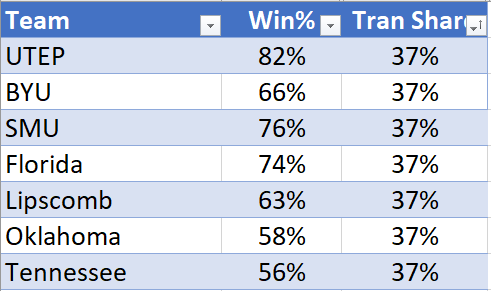
These two metrics are a little more stylistic. We’ll see next week if there’s any correlations between playing more or less of the rally in Transition, but it is interesting that the highest-Transition Share teams tend to be good teams from smaller conferences. This is likely a result of them being very good defensively, playing against some conference opponents that aren’t as terminal in First Ball.
Transition Efficiency Leaders
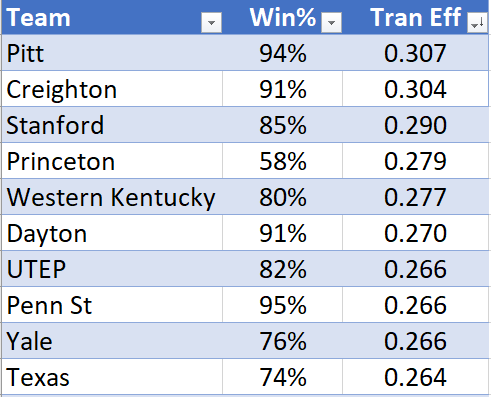
Now we’re looking at the teams with the highest hitting efficiency in transition. Clearly this is related to winning lots of rallies in transition as well. Pitt and Creighton were at the top of both lists. Next week we’ll look at how well (or not) hitting in Transition is related to hitting in First Ball.
Opponent Transition Efficiency Leaders
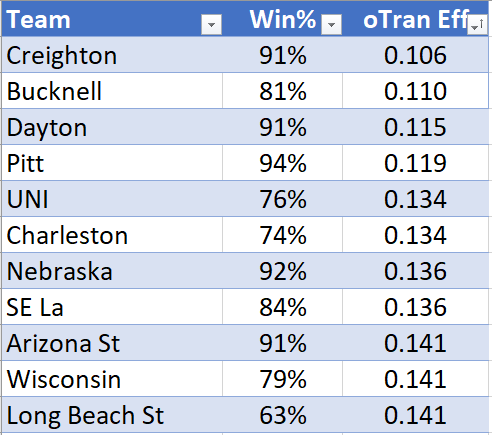
And here’s the teams who limited opponent transition attack the best. Creighton and Pitt, both right near the top again. No surprise they were in the mix for the National Championship!
For the small schools, you also see Bucknell, who was one of the best transition teams in the country, high up on this list. If you can hold your opponents to 0.100 hitting in transition, you have a really good shot to win.
Next week I’ll bring in some scatter-plots and correlation and see how these components compare influenced winning and losing.