
Part 1 - Terminal Serving
Part 2 - First Ball
I’ve been doing a bunch of Triangle analysis here in the spring.
24 NCAA Women’s Analysis
25 LOVB Analysis
What’s still left on the calendar? The NCAA Men’s season, plus the PVF. Of course, there’s also European Champions League and other international competitions. I might be able to get some analysis done on those championships, but… there’s only so much time and space without SmarterVolley turning into nothing but match analysis posts. So we’ll see.
But for now, men’s volleyball! As a reminder, if you are unfamiliar with the Triangle analysis framework or some of the other terminology I use here, check our the Triangle Primer that I updated for this year. The data that I used was from the top-20 teams, plus playoff qualifiers Belmont Abbey, Penn State, and Daemen. I didn’t include Fort Valley St because they don’t have enough matches up on Volleymetrics.
2025 NCAA Men - Transition
Let’s take a look at how Transition Differential influenced winning in this year’s NCAA Men’s Volleyball season.
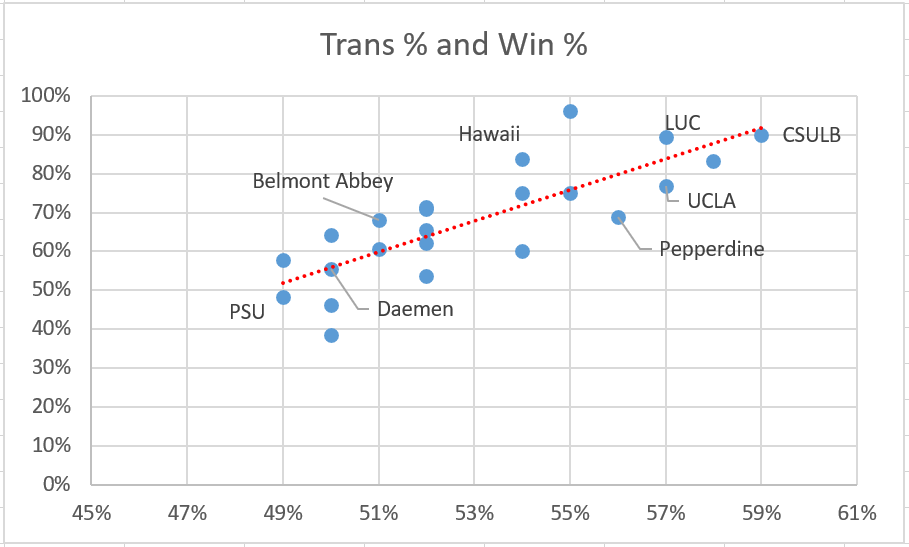
As you might expect, the correlation here is strong to winning. In fact, the Transition correlations are as strong or stronger than the First Ball correlations.
Transition-related Correlations
0.80 - Transition Differential
0.62 - Transition Efficiency
0.71 - Opponent Transition Efficiency
This is interesting because Transition is a relatively small share of the game in NCAA men’s volleyball.
Average Share Of Each Phase
25% - Terminal Serving
46% - First Ball
29% - Transition
If you recall, about 40% of the NCAA women’s game is played in Transition. There’s more First Ball and a lot more Terminal Serving in NCAA men’s. Yet the Transition differential is just as influential on winning. Part of that is almost certainly co-correlation with the other aspects.
Transition Differential doesn’t suffer from the same good teams get less chances to attack problem that can affect First Ball Differential. In fact, Transition Differential arguably has a bit of a skew the other way, in that winning teams serve more, and thus get the first opportunity to dig and transition.1
Unlike First Ball, where the offensive efficiency was correlated slightly more to winning than defensive efficiency, we see the opposite with Transition. Transition defense was slightly more correlated to winning in this season. I wouldn’t read too much into that. The correlations are probably close enough that, absent a multi-season trend, we can probably just say “offense and defense are of similar importance.”
First Ball v Transition Offense
What is interesting is to look at each team’s First Ball and Transition offenses. How much are the two related? In the LOVB Women’s season, we saw that the two weren’t strongly-correlated. Let’s look at the relation in the recent men’s season.
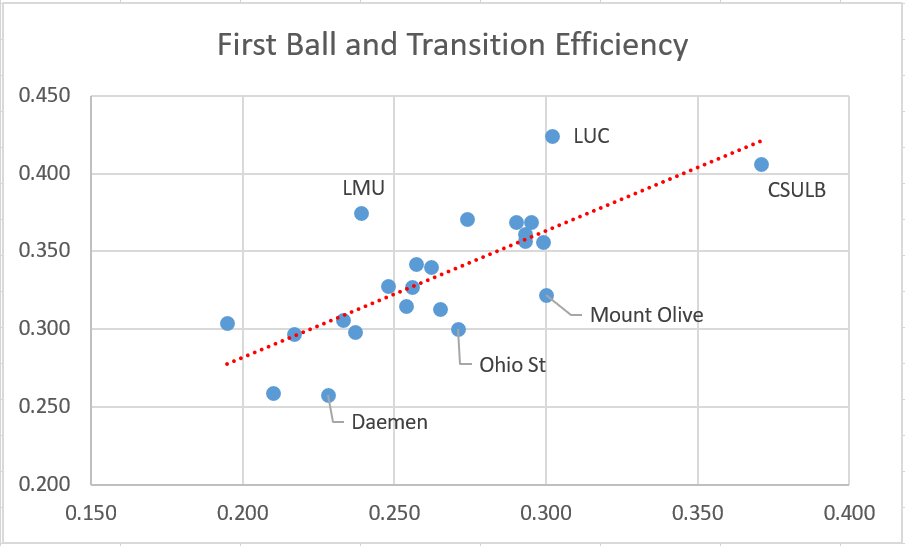
(If you’re above the trendline, you’re relatively stronger in First Ball. If you’re below the trendline, you’re relatively stronger in Transition. If you’re right on the trendline, you’re equally good at both.)
Well, that’s different! There was a clear strong correlation (0.75) between First Ball Offense and Transition Offense in this recent men’s season. In fact, when we look at the defensive comparisons:
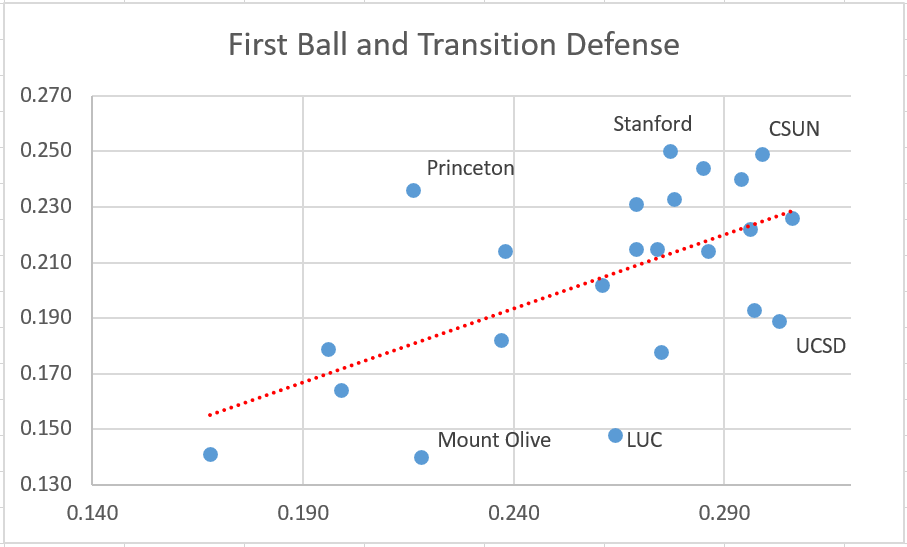
(Same thing applies here. If you’re above the trendline, you’re relatively better in First Ball defense. If you’re below, you’re relatively better in Transition defense.)
We see less correlation (0.60). That’s still fairly high, but it is interesting nonetheless. In the LOVB Women’s season, how good you were in First Ball Offense didn’t really predict how good you were in Transition Offense. But in this recent NCAA Men’s season, it did. On the flip side, how good you were in First Ball Defense very strongly predicted how good you were in Transition Defense in the LOVB Women’s season, but the correlation, while still fairly high, wasn’t as strong in the NCAA Men’s season.
What’s also interesting is that there was not a correlation between your First Ball-ness and Transition-ness between offense and defense. For example: Loyola was relatively better offensively in First Ball but relatively better defensively in Transition.
I’m not sure what that tells us yet, but I’m interested to continue to study that some more. What are your thoughts? Leave a comment if you have one.
Playoff Matchups
Keep reading with a 7-day free trial
Subscribe to Smarter Volley by Joe Trinsey to keep reading this post and get 7 days of free access to the full post archives.