
I spent most of this spring breaking down the major American volleyball leagues. There’s a fair amount of new subscribers to SmarterVolley, so every now and then I like to play catch-up and put things in an organized mega-post for new subscribers to see some stuff they want to read up on.
NCAA Women
This was the most extensive series, and it’s a big data-set. Some good stuff in there if I say so myself.
Part 1: Terminal Serving Leaderboard
Part 2: Terminal Serving Correlations
Part 3: First Ball Leaderboard
Part 4: First Ball Correlations
Part 5: Transition Leaderboard
Part 6: Transition Correlations
NCAA Men
Part 1 - Terminal Serving
Part 2 - First Ball
Part 3 - Transition
I highlighted the quarterfinal playoff match between Loyola and Pepperdine as one of the most interesting ones to watch. I forecast a super-tight Pepperdine victory with Pepp earning a small edge in Terminal Serving, the teams playing even in Transition, and Pepp hitting about 0.310 in First Ball.
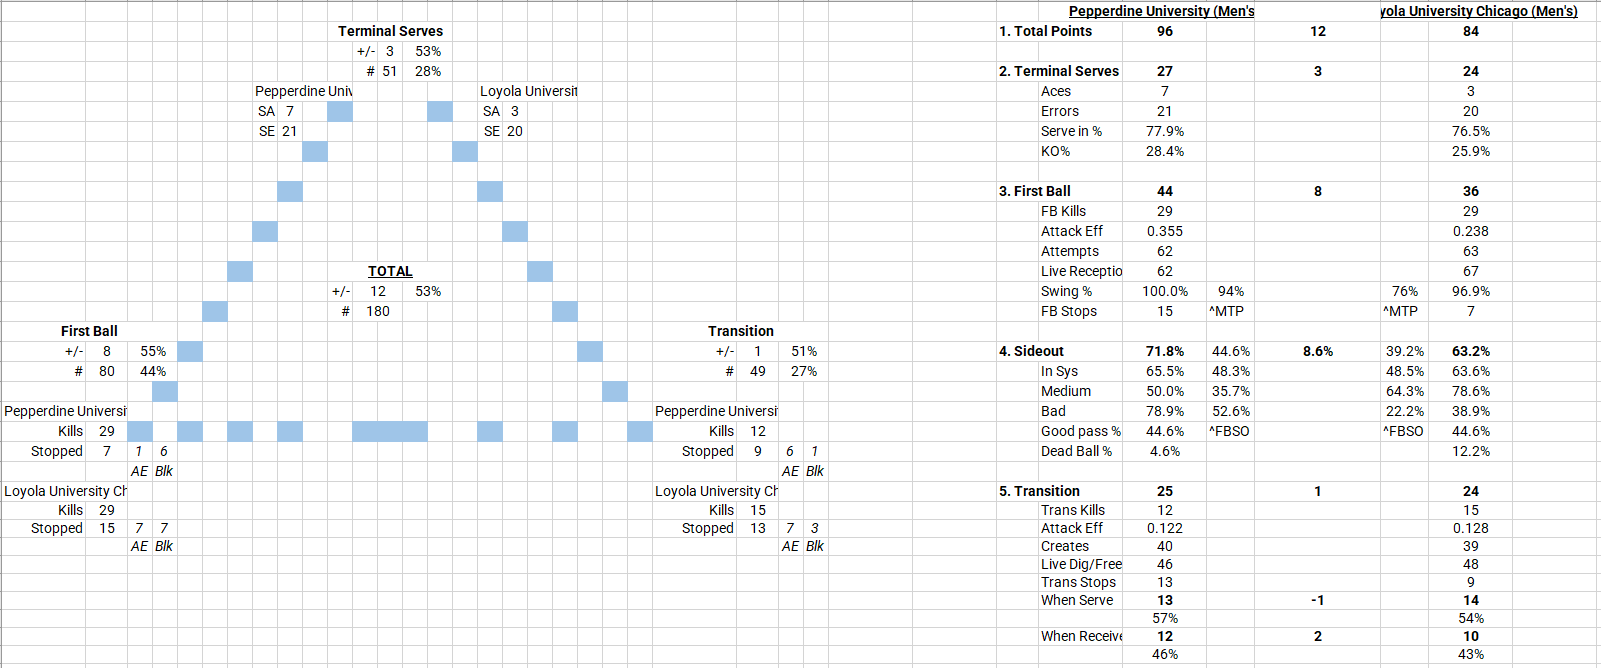
Well let’s see… Pepp had a 3-point edge in Terminal Serving (7 aces and 21 errors to Loyola’s 3 aces and 20 errors) and the teams were basically even (1-point edge to Pepp) in Transition. And Pepp hit 0.355 in First Ball. Pretty close in predictions.
What I didn’t forsee was how well Pepp would be able to slow down Loyola in First Ball. The Loyola sideout offense was the best in the country this year, but you can see there that Pepp held them to 0.238. Loyola only sided out at 64% when they passed in-system. Bigtime block/defense by Pepperdine to earn their way to the semi-finals, where they gave Long Beach a pretty close match. Great season by the Waves.
Despite losing to Hawaii in the Big West final going into the playoffs, most people still had Long Beach as the favorite to take home the championship. They didn’t disappoint. Here’s what the stats looked like:
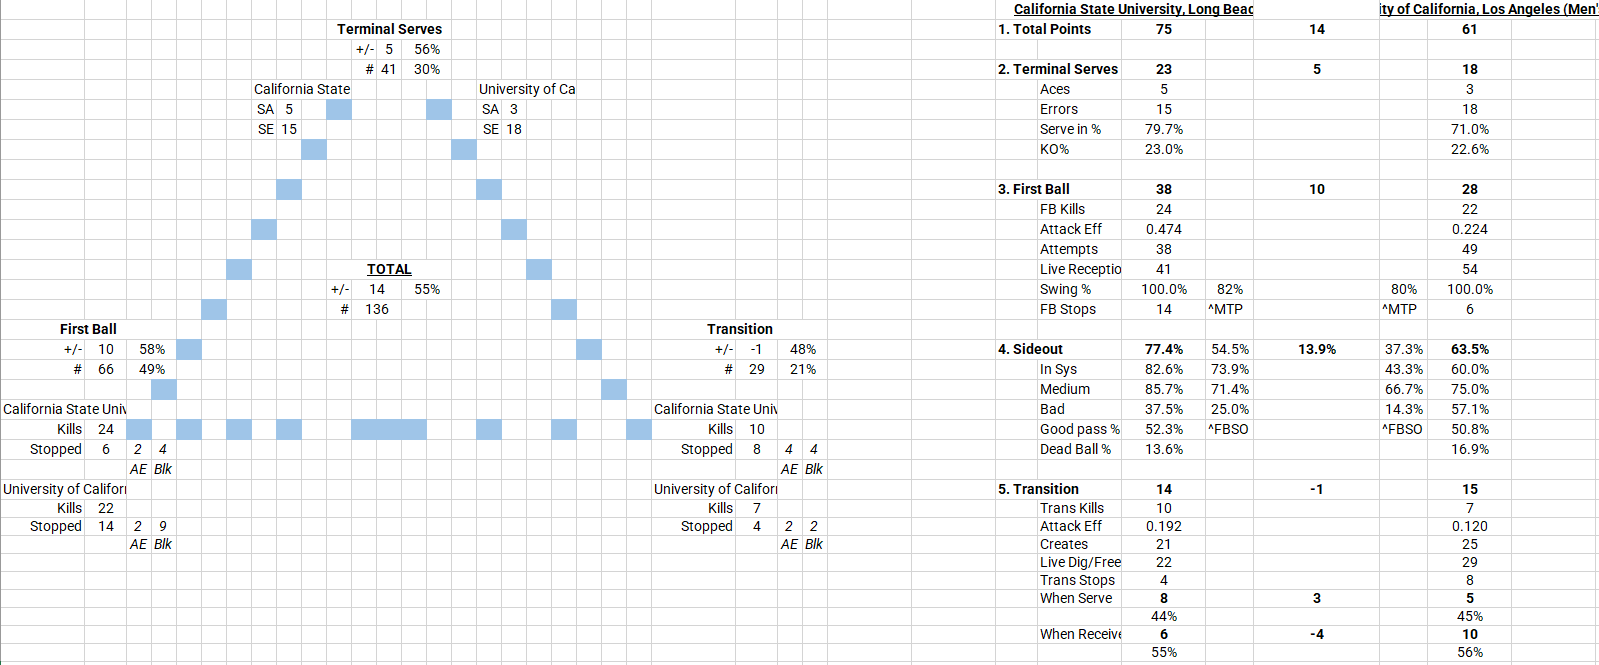
Long Beach Triangle
+5 Terminal Serving
+10 First Ball
-1 Transition
Long Beach was dominant in First Ball- particularly with their block. They stuffed UCLA 9 times on 49 First Ball attempts. And they were super-terminal: 24 kills on 38 of their own attempts.
Both teams played pretty clean, low-error ball in First Ball, with 82% and 80% MTP despite some big serving pressure. Long Beach was just absolutely dominant when UCLA didn’t serve them out-of-system. Just too much offensive pressure. And for fun, how about a Nikolov highlight?
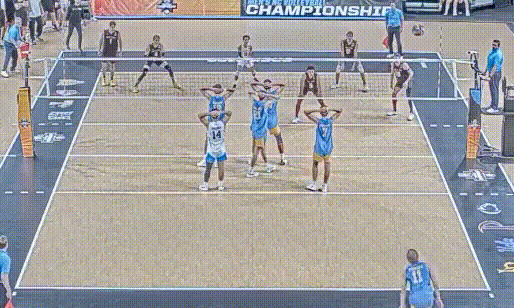
You don’t often see an on-2 Pipe from a setter. Pretty sweet play.
LOVB
Part 1: Terminal Serving
Part 2: First Ball
Part 3: Transition
Playoff Analysis
The LOVB playoffs were full of upsets, with 5-11 Austin making a run to the championshp. Just playing the long game eh?
PVF
I’d love to put an analysis of the PVF playoffs up here but… the Finals isn’t on Volleymetrics. Come on people! (Am I missing something? Tell me in the comments if I am)
NCAA Beach
I wrote briefly about being down in Gulf Shores for the NCAA Beach National Championship. LMU made it to the Finals before falling 2-3 to TCU. There’s lots of great matches to unpack here, so I’ll be resuming some Sandy Sunday posts where I apply my beach analysis framework. I shared some of that this spring as well.
Diagnostic Panel Part 1
Diagnostic Panel Part 2
Beach “Rotations”
Check back over the summer for more of those beach analysis posts.
Summer Look-Ahead
This summer the theme is Teaching. I’ll still run some of the more quantitative articles (especially on the beach side), but the focus will be on some of the softer skills of coaching. Given what we want to teach, how do we teach the game better?